Wallstreet1928 Analysis & live calls on FTSE,DAX,S&P...aimed to help New traders

Status
Not open for further replies.
s500 dropped nearly 2% in the last 30 mins of trading
808 to 794

and I enjoyed every minute of it, why do you ask?

I'll let you work the rest out for yourselves

lets see what tomorrow will bring chaps

Analysis time

a special request goes out to those who follow this thread(I am very flattered by it, and It made me so happy today when i got a message from a newbie who put his first trade on for a profit and thanked me for the guidance i have given him)

I would like you to alert me when I start to diverge away from my trading plan the night before

i will be very grateful for it

i have done it twice in the last 2 weeks and It has cost me

Discipline is one of the hardest traits to master, no matter how long or how experienced you are as a trader ...............that's why only 5% of traders succeed and make money!!

I would like everyone on this thread to be amongst the 5%............
 
you deserve it my friend, you are a very good trader

I should call you the sheriff .............!! that's your new nickname candles!!

LOL...but I dont wanna be the sherrif :cry:
And when you give someone a name like 'The sheriff', it makes it sound like that person insists that that's how people address them! haha. Like, when I was younger, my mates dad was a pilot, and he always made people call him 'captain'.

I am currently flat. I was tempted to get short at the close, as it looked negative, but i dont like shorting after a viscious drop. Was hoping for a little rally after the close to short but It just carried on dropping without me on board.
Will start from scrath tomorrow and see how we get on. Ill likely be looking for short opportunites though...
 
FTSE analysis for April Fools day


strategy


toss a coin


heads = buy

tails = sell

i will be posting all calls live..................hahaha!!
 
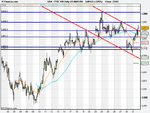
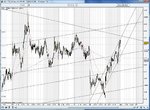
FTSE analysis

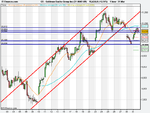
1 month 1 hr

I seem to be witnessing a downtrend channel forming - 2 red trend lines


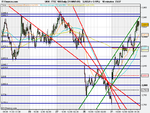
1 week 10 mins

contradictory to 1 month 1 hr chart .........

green lines depict upward channel forming here

strategy

scenario 1 - green channel broken and market trades below 3875 and takes out 20 and 50 & 200 MA's then i will go short until 3850 -3800

scenario 2 - very unlike as we have failed to stay above 800 on S&P but this market is crazy so we can't afford to discount anything
if green channel intact then i will go long provided we remain above 3900 convincingly upto 3940-3950-3960 .....................
 

Attachments

  • 31st march .png
    31st march .png
    20.3 KB · Views: 111
  • 31st march 23.43.png
    31st march 23.43.png
    29.1 KB · Views: 125
Woo hoo I won a half day off at work tomorrow so will be around for th S&P open and close! Still on the sidelines though as I get my discipline going and my trend analysis going strong.

So far so good the discipline of telling myself not to make a real trade is working very well!
I used to dive in trying to catch the market or find the opportunity but with this more laid back wait for the market to come to me approach and only setting to about 3 trades a day max it's going well so far!

See you tomorrow guys!

Vikash
 
Last edited:
Yes WS, April fools day - Does that mean we need to be extra careful? lol

Lets see what tmrw brings... will also ponder over my analysis later if i dont fall asleep...
 
just woke up, cant get to sleep so I thought i'd do some analysis

I have to get up for the Dawn prayers, Fajr Salah as the Arabs call it ...............

Rio TIto analysis

1 month 1 hr chart

several channels within a channel

blue channel is importance to me

I will be looking to short Rio tinto down to S2 level of 2250


1 week 1 hr chart show the same analysis - short till 2250
 

Attachments

  • rio pt2.png
    rio pt2.png
    20.7 KB · Views: 130
  • rio tinto .png
    rio tinto .png
    26.7 KB · Views: 129
Breakdown of Goldman Sachs still the key to this market going down

huge market leader .............

It did try to trade above yesterdays closing price but failed miserably in the last 1 hr and sold off

if it goes below 100 then we will witness carnage in these markets and see 769 on the S&P
 

Attachments

  • GS 010409.png
    GS 010409.png
    20.3 KB · Views: 110
Last edited:
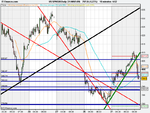
S&P analysis for 1st April

1 week 1 hr

Green line presented a beautiful shorting opportunity, and boy did i take it........

2 important levels are highlighted - thick blue horizontal lines
788 - gap fill
779 - intra-day low on 30th march

strategy

scenario 1 - if 788 fails to hold then I will be shorting until 779

scenario 2 - very very unlikely because i ultimately believe this market is going to 769 .....but we must cover every scenario
I will sit on the sidelines until we trade above 800 again and then go long - but like i said very very unlikely

this market is due a hammering................. 769 target
 

Attachments

  • 5.01.png
    5.01.png
    24.9 KB · Views: 107
BARCLAYS .............Is 120 on the cards

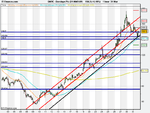
the chart for barclays is looking ugly .................if 140 broken(black trend line) then we go down to 126- 120 or even the 200 MA of 100p !! Interestingly I believe that this will coincide with Goldman Sachs falling below the $100 ..........

i shall be waiting for a break below 140 and i will then open up a short .............. whilst keeping an eye on Goldman Sachs as well
 

Attachments

  • 1.04.09.png
    1.04.09.png
    22.5 KB · Views: 106
FTSE analysis

1 month 1 hr

I seem to be witnessing a downtrend channel forming - 2 red trend lines


1 week 10 mins

contradictory to 1 month 1 hr chart .........

green lines depict upward channel forming here

strategy

scenario 1 - green channel broken and market trades below 3875 and takes out 20 and 50 & 200 MA's then i will go short until 3850 -3800

scenario 2 - very unlike as we have failed to stay above 800 on S&P but this market is crazy so we can't afford to discount anything
if green channel intact then i will go long provided we remain above 3900 convincingly upto 3940-3950-3960 .....................

Morning WS, I also want to thank you for your insperation it gives me confidence in my own trading and analysis, and please pass my good wishes to your wife, i hope everything works out ok.

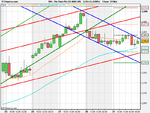
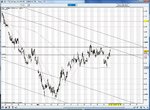
I just thought I would add my analysis to your FTSE interpretation. as my hourly chart shows I almost agree with yours but my top trendline line just passes over the top of the highs so far (and that trend line has been in place for over a week on my chart) so I am leaning more towards shorting the FTSE with it touching on that confirmed downtrend, but I will need to see confirmation before entering.

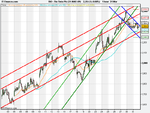
The only thing that bothers me is if you look at the 10 minute chart its wip sawing about like a crazy index, gapping up then a day or so later its gapping down big moves, and so intraday is really hard to call. Anyone else having the same thoughts?

here is my hourly and 10 minute charts attached:
 

Attachments

  • ftse1hour.jpg
    ftse1hour.jpg
    192.6 KB · Views: 116
  • ftse10min.jpg
    ftse10min.jpg
    237.7 KB · Views: 109
Morning WS, I also want to thank you for your insperation it gives me confidence in my own trading and analysis, and please pass my good wishes to your wife, i hope everything works out ok.

I just thought I would add my analysis to your FTSE interpretation. as my hourly chart shows I almost agree with yours but my top trendline line just passes over the top of the highs so far (and that trend line has been in place for over a week on my chart) so I am leaning more towards shorting the FTSE with it touching on that confirmed downtrend, but I will need to see confirmation before entering.

The only thing that bothers me is if you look at the 10 minute chart its wip sawing about like a crazy index, gapping up then a day or so later its gapping down big moves, and so intraday is really hard to call. Anyone else having the same thoughts?

here is my hourly and 10 minute charts attached:

thank you my friend

with regards to your chart

with regards to 10 min chart of the FTSE, yes its is very volatile and very hard to trade as I mentioned in my last few posts

you have to be a very good trader to succeed in these markets

its hard with all these whipsaws either side.......

The S&P rose above 800 last night which really confused me but after further analysis aI realised it was on low volume(credibility of rise was eroded and therefore fell like a brick in last 30 mins whilst i was shorting )
 
OK chaps ........were off to the races

i am short S&P 787 ....stop loss 792

i am short FTSE 3874 stop loss 3904
 
just woke up, cant get to sleep so I thought i'd do some analysis

I have to get up for the Dawn prayers, Fajr Salah as the Arabs call it ...............

Rio TIto analysis

1 month 1 hr chart

several channels within a channel

blue channel is importance to me

I will be looking to short Rio tinto down to S2 level of 2250


1 week 1 hr chart show the same analysis - short till 2250

my Rio Tinto trade is working like clockwork

2250 here we come
 
just woke up, cant get to sleep so I thought i'd do some analysis

I have to get up for the Dawn prayers, Fajr Salah as the Arabs call it ...............

Rio TIto analysis

1 month 1 hr chart

several channels within a channel

blue channel is importance to me

I will be looking to short Rio tinto down to S2 level of 2250


1 week 1 hr chart show the same analysis - short till 2250

target met

nice profit there
 
FTSE - taken 20 points profit on 2 contracts., amended last contract to break even

wow! thats brilliant! I used a limit order to enter the market short @ 3876 (just below that support line) with a stop at 3896 and also made it a further limit order to buy at 3850. I have just been out on the school run (my turn) and when I got back the order has been filled at 3876 and also the trigger to buy came in at 3850 making 26 point profit!

cant beat automatic orders :)
 
Status
Not open for further replies.
Top