Wallstreet1928 Analysis & live calls on FTSE,DAX,S&P...aimed to help New traders

Status
Not open for further replies.
Afternoon, guys. I stopped by yesterday to introduce myself - total newbie. Interesting charts, just wish i knew how best to interpret them :)

I'm having a read through some of the things on stockcharts.com - hopefully, some of it will stick. In the meantime, I'll keep peaking over your shoulders to see what i can pick up, if that's ok. All the best!

pick up a simple TA book. i got one called Tech Analysis Demystified by Constance Brown...very simple, basic stuff, but great for explaining the fundamentals of charting etc.
 
Hi OMG

InTheMoneyStocks-www.inthemoneystocks.com is a good starting point - see 'rant and rave blog' for their most recent analysis - they're on YouTube as well.

When you work out what all this analysis means, do let me know :LOL:

Will do, lol - and thanks for the welcome! I was on "inthemoneystocks.com" this morning after having seen reference to it here in earlier posts. I thought all the juicy bits were behind the premium door though.

I'll take a look at the blog as suggested. (y)
 
Will do, lol - and thanks for the welcome! I was on "inthemoneystocks.com" this morning after having seen reference to it here in earlier posts. I thought all the juicy bits were behind the premium door though.

I'll take a look at the blog as suggested. (y)

Yeah, you may be right, it could be all the juicy bits are for premium. I plan on signing up to the reasearch centre in a few weeks to see what else I can find (gotta move house first, oh joy!)

I found a link on Google to John Murphy TA book Technical analysis of the financial ... - Google Book Search he's well respected, though haven't read it myself.
 
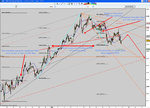
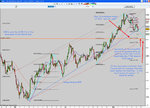
My amateur analysis (H1 & H4) for FT below ;). Apologies, as it's a bit busy on the charts, as I had lots to say, but I hope some sense can be made. The images are large, so it might be easier to read if downloaded.

I've used a lot of fib measurements - the swings I measure are marked in blue. My down target of 4210 is mostly based on my theory that large FTSE moves might retrace 50%, and that there's a few fibs lining up together at the 4210 level. If 4210 failed, I would look for 4160 next.

Anyway, despite all this analysis, I have a simple plan - I'll be looking for shorts, unless we break Fridays high. If we break Fridays high I'll take that as a continuation of trend signal, and look for longs. I'll be watching for bounces and breakhtroughs of the trendlines I have drawn to provide confirmation of direction either way.

So, first target is 4210 - lets see! Again, feel free to crit my analysis. I'll probably be wrong, but I enjoy having a go. If I'm right, you can rep me later ;)
 

Attachments

  • fth1.jpg
    fth1.jpg
    337.3 KB · Views: 100
  • fth4.jpg
    fth4.jpg
    341.4 KB · Views: 96
My amateur analysis (H1 & H4) for FT below ;). Apologies, as it's a bit busy on the charts, as I had lots to say, but I hope some sense can be made. The images are large, so it might be easier to read if downloaded.

I've used a lot of fib measurements - the swings I measure are marked in blue. My down target of 4210 is mostly based on my theory that large FTSE moves might retrace 50%, and that there's a few fibs lining up together at the 4210 level. If 4210 failed, I would look for 4160 next.

Anyway, despite all this analysis, I have a simple plan - I'll be looking for shorts, unless we break Fridays high. If we break Fridays high I'll take that as a continuation of trend signal, and look for longs. I'll be watching for bounces and breakhtroughs of the trendlines I have drawn to provide confirmation of direction either way.

So, first target is 4210 - lets see! Again, feel free to crit my analysis. I'll probably be wrong, but I enjoy having a go. If I'm right, you can rep me later ;)


very good analysis my friend, I certainly appreciate the effort you went to

we are all rookies so don't worry
 
very good analysis my friend, I certainly appreciate the effort you went to

Thanks WS.

All eyes on the UUP index tommorow I think.

I've been watching EUR/USD quite closely the last few weeks, and the EURO got hammered a bit on Friday, another reason why I'm bullish short term on the Dollar.
 
Last edited:
:whistling Here we go... first of many newbie questions, no doubt.

What's the UPP index? :confused:

No probs OMG.

The UPP is the Dollar Index that inthemoneystocks are keeping an eye on, the theory being that if the Dollar gains strength, the markets will go down.

Sometimes it appears that stocks corolate with other indexes or commodities, like Gold for example. Why the correlation changes from one thing to another, I'm not sure yet.

edit: make that UUP index!

You can access the UPP index on freestockcharts.com if you're interested.
 
Last edited:
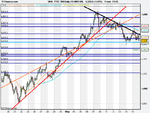
FSTE analysis for Monday 18th May

2 trendlines is all I need to know about

black downward sloping trendline- It has been hitting it al week and it is getting weaker and weaker , if broken then we go northwards with ferocity & velocity

light blue horizontal trendline- techinical analysis states buy double bottoms/tops but be cautious with triple bottoms/tops ...........so I will adopt a wait and see attitude!!

4315 - support

4360 - resistance on the upside


US $ rises = US markets falls + oil falls = oil/gas sector falls = along with weak banking sector(weak barclays chart) = FTSE falls


and vice versa


main variable to trade the FTSE in the morning will be...........ignoring the US dollar variable as that will impact my trading later in the day.

Miners and banks - They were the 2 sectors that helped the FTSE on Friday.......if they show signs of weakness/strength then I will go long/short accordingly

miners - I use Anglo American and Rio Tinto as market leaders for Mining sector along with index on CMC

Banks - I use Barclays as market leader in my book
 

Attachments

  • FTSE 100 Daily (15-MAY-09).png
    FTSE 100 Daily (15-MAY-09).png
    21.5 KB · Views: 161
Last edited:
Geo thanks for sharing your analysis, and WS, thanks for sharing your knowledge on the influence of correlating markets. i hope i can soon contribute some meaningful analysis (preferably before i get old and wrinkly).
 
Just a quick question for the great and the good ;)

Do you watch for candlesticks creating pin bars/long tails/wicks, and then take them to be a rejection of a certain price point? Then, if that is a rejection, and that rejection happens to coincide with a trendline, then that is a price action signal for a reversal/bounce, etc?

When I first heard that phrase 'trade what you see.. etc', it made no sense, but the above is now what I think that phrase means (at least in part), and what I look for - Am I on the right track, or is this trash ;)
 
Status
Not open for further replies.
Top