Wallstreet1928 Analysis & live calls on FTSE,DAX,S&P...aimed to help New traders

Status
Not open for further replies.
guys - here's the market data source for the FreestockChart s/w....

there is also a european presence for the company as well so maybe non domestic US data is possible.

BATS Exchange || Market Data Tools
BATS Europe


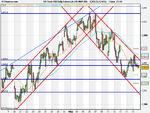
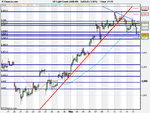
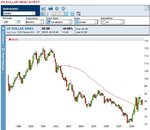
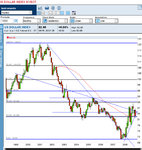
lol oops looks like the main indicies are on there..but no data on the graphs below daily.. maybe cause of w/end
 
Last edited:
Nasdaq analysis - 1 month 1 hr

downtrend still intact

channel working out beautifully for shorting opportunities

next target 1348 gap fill and 1340 May 13th low

Nasdaq leader for S&P ...so slightly worrying for S&P but Nasdaq was quiet strong on friday until late sell off.
 

Attachments

  • US Tech 100 Daily Future (Ju (15-MAY-09).png
    US Tech 100 Daily Future (Ju (15-MAY-09).png
    25.7 KB · Views: 103
US oil -

red line = up-trend break out = BP break out on down side and airline stocks EJZ & BAY rise

light blue trend line = trigger for long position

gap gill $56 will be good buying opportunity
 

Attachments

  • US Light Crude (JUN-09).png
    US Light Crude (JUN-09).png
    19.1 KB · Views: 94
Last edited:
and the fuel supplier.i wonder which one buys the watered down stuff..??
 

Attachments

  • bpsun.gif
    bpsun.gif
    9.8 KB · Views: 91
ftse100..does not want to close above 4430
7 day candles
 

Attachments

  • 4430ukx.gif
    4430ukx.gif
    4.7 KB · Views: 97
ws..
ndx.the range is getting tighter,and the support has moved a tad higher.it could get even tighter. 4 day candles
 

Attachments

  • ndx.tight.gif
    ndx.tight.gif
    4.4 KB · Views: 106
can somebody provide a forecast and analysis on the dollar index please?

it holds the key for this stock market to resume its uptrend ..............

"Indeed, the US Dollar Index broke the 200 day moving average on 8th May and closed below it. The index also dropped through a major trend-line that ran from 15th July to 18th Dec on the same day. In most cases this is a very strong bearish signal.

Now that the US dollar has now clearly broken the 84-85 level, we should test the 80.53 level.

As technical traders for many years we have noted with interest moves such as the above mentioned. What we do not like to see is many technical analysts calling the same thing. For this reason the next 24-48 hours things might get a little choppy.
It is our view that in the bigger picture the US dollar is in a downtrend that will ultimately see the it probing towards the low 70’s. A weaker dollar would suit the US, as it would raise US exports and raise the US stock market. If the US stock market goes up then confidence will return. Of late, the two have a reasonable correlation with each other."

can somebody please provide a good website for US dollar index analysis?
 
Last edited:
Morning Wallstreet

You can access the UUP dollar index, the same one that inthemoneystocks referred to on Friday, through the freestockcharts.com software.
 
Last edited:
Analysis on the monthly on image below. That's the most basic charting package I ever used :LOL:

Gut feeling, more upside - I have the same vibe with UUP index, but WTFDIK!
 

Attachments

  • worthless_dollar_2.jpg
    worthless_dollar_2.jpg
    295.9 KB · Views: 92
UUP bouncing down of a downward trendline on the 1 hour from 20th April, but also bouncing up from the 50% fib of a previous swing sometime ago @ the 24.65 level.

My call would be a retrace to the 38.2 fib (top red line) to 25.13 of the most recent swing down from the 20th April. Lets see anyway.

I have the FTSE going down to 4213 ish area. I'll post my analysis later FWIW.
 

Attachments

  • UUP.jpg
    UUP.jpg
    246.1 KB · Views: 518
Link to my UUP analysis if anyone interested - you will have to look at the daily to see the 50% fib I refered to in previous post.

FreeStockCharts.com - Web's Best Streaming Realtime Stock Charts - Free

Feel free to rip my analysis to bits, I'm quite happy to have other opinions - I'm here to learn.

edit: not sure that link works properly, it might link to a previous analysis!!

edit edit: Discard your last session, and it should load ok.
 
Afternoon, guys. I stopped by yesterday to introduce myself - total newbie. Interesting charts, just wish I knew how best to interpret them :)

I'm having a read through some of the things on stockcharts.com - hopefully, some of it will stick. In the meantime, I'll keep peeking over your shoulders to see what I can pick up, if that's ok. All the best!
 
Last edited:
Status
Not open for further replies.
Top