Mr. Charts
Legendary member
- Messages
- 7,370
- Likes
- 1,200
Some might find my first trade today of interest.
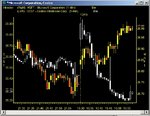
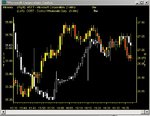
SNDK was on my radar after its dive yesterday and I was anticipating a rapid early move.
Y'day the low was 60.63 and the close 60.80. The premarket low was 60.75. These, imo, are key levels. The latter was my anticipated short entry level.
The stock opened up and touched 61.39 before plummeting.
I was watching the Time and Sales and level 2, reading what was happening and as the price fell towards my entry level both those screens told me almost no-one wanted to buy this stock but sellers abounded. I got my short entry on an uptick at 60.74 at 14.33 and watched it hurtle south. It reached a low of 58.75 within only four minutes and then the buyers came in. Once I could see this was genuine buying on T&S and level 2 and the price was retracing, I exited as it hit 59, getting a fill at 59.02.
At all times the stock was extremely liquid with tight spreads.
This was a $1.72 move in four minutes based on some very basic TA, plus reading those screens. The trade was all about price action off key levels and not a single TA indicator was used.
What was also interesting later at 15.13 was that the price returned to that critical 60.75 level and bounced straight down off it. I didn't trade that later move.
These markets are sometimes proving difficult, but there are very often powerful and profitable trades to be had in the first few minutes. Sometimes the main moves of the day can be over very quickly, but equally you often get late moves after 7pm.
I don't think anyone should consider trading a move like the one I did on SNDK unless they have really learned what they are doing.
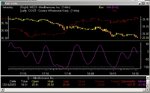
Anyone really interested can open a one minute candlestick chart for further clarification.
Hopefully some people might find this post useful in terms of the methods employed.
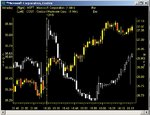
SNDK was on my radar after its dive yesterday and I was anticipating a rapid early move.
Y'day the low was 60.63 and the close 60.80. The premarket low was 60.75. These, imo, are key levels. The latter was my anticipated short entry level.
The stock opened up and touched 61.39 before plummeting.
I was watching the Time and Sales and level 2, reading what was happening and as the price fell towards my entry level both those screens told me almost no-one wanted to buy this stock but sellers abounded. I got my short entry on an uptick at 60.74 at 14.33 and watched it hurtle south. It reached a low of 58.75 within only four minutes and then the buyers came in. Once I could see this was genuine buying on T&S and level 2 and the price was retracing, I exited as it hit 59, getting a fill at 59.02.
At all times the stock was extremely liquid with tight spreads.
This was a $1.72 move in four minutes based on some very basic TA, plus reading those screens. The trade was all about price action off key levels and not a single TA indicator was used.
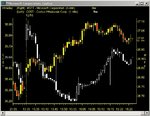
What was also interesting later at 15.13 was that the price returned to that critical 60.75 level and bounced straight down off it. I didn't trade that later move.
These markets are sometimes proving difficult, but there are very often powerful and profitable trades to be had in the first few minutes. Sometimes the main moves of the day can be over very quickly, but equally you often get late moves after 7pm.
I don't think anyone should consider trading a move like the one I did on SNDK unless they have really learned what they are doing.
Anyone really interested can open a one minute candlestick chart for further clarification.
Hopefully some people might find this post useful in terms of the methods employed.