Trading the SPX

Good day all,

Another day another pip... one way or another...

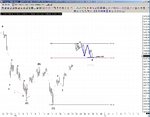
I feel SPX is going to try for 1428-30 today, fail and flop back down to 1415 regions. I think we tested 1420 briefly yesterday but I think it was in response to false rumours.

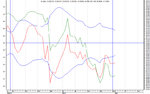
Watching the 1 hour charts at the mo and it's trying it's best. On my TA I think it's going to touch MA34 or 55 and move back down. Will be watching to see if it brakes that or not as a decider for direction. 9 + 18 MAs about to cross over.

More importantly, I'd be interested to see if it repeats last two session pattern of moving down up and back down again.

I'm still very much bearish.
 
That was short but sweet. I've closed position for small gains...

Waiting for small bounce as oil comes down a little. For some reason I think the markets will try to stabilise before collapsing.

Just a hunch nothing more.
 
Strong resistance at about 1438 ish.
All oil companies up though, with an increase in the price of oil ( summer motoring season coming up)
Benny is giving us the benefits of his remarks, which should make a difference.
Blair huffing and puffing over Iran's actions.
Should flatten their facilities in my opinion.
 
Last edited:
Pat494 said:
Strong resistance at about 1438 ish.
All oil companies up though, with an increase in the price of oil ( summer motoring season coming up)

Hi Pat494,

I was thinking in this climate we'd be lucky for 1428 to be reached. But I don't know. Very bearish but expecting some kind of fight from the bulls.

Waiting for Bernanke's speak...
 
It is now in a primary cycle down and has been since the middle of last month.

Today we're expecting a weak opening across the board and I will be looking with interest to pick up on what happens around both the 1410 and 1420 areas.

Definitely a day to watch volumes like a hawk.

Technically weak all the way down to 1340.
 
There's still this possablity for the bulls to hold onto....

Nice line in the sand the 1421 area... The lesser 1:1 comes in at 1418 so key areas for the bulls to defend before the 38.2% of the whole move....
 

Attachments

  • outside4bull.jpg
    outside4bull.jpg
    192.5 KB · Views: 245
Last edited:
Bez said:
There's still this possablity for the bulls to hold onto....

Nice line in the sand the 1421 area... The lesser 1:1 comes in at 1418 so key areas for the bulls to defend before the 38.2% of the whole move....

Only Bernanke can turn this market.

I'm short again at 1420. I can't see 1428 anymore. Too far down this big black hole...

Good luck everyone...
 
Connie Brown said:
It is now in a primary cycle down and has been since the middle of last month.

Today we're expecting a weak opening across the board and I will be looking with interest to pick up on what happens around both the 1410 and 1420 areas.

Definitely a day to watch volumes like a hawk.

Technically weak all the way down to 1340.
For anyone using Value Line Analysis, or Market Profile as a reasonable proxy, you'll note the 1420 level was the pivot point for the entire trading session.

S&P down in harmony and in similar strength to the other averages today and if you were into the possibility of oscillation, you hopefully made profits today.

Tomorrow? Still technically weak to 1340 and nothing will tempt me into a long position while the primary is in a down cycle. While oscillation requires a higher number of quick hits to make the tally, we all like to take the meat out of the main trends. Still no sign of that, but that 1410 level is key to a potential bear run.
 
Connie Brown said:
For anyone using Value Line Analysis, or Market Profile as a reasonable proxy, you'll note the 1420 level was the pivot point for the entire trading session.

S&P down in harmony and in similar strength to the other averages today and if you were into the possibility of oscillation, you hopefully made profits today.

Tomorrow? Still technically weak to 1340 and nothing will tempt me into a long position while the primary is in a down cycle. While oscillation requires a higher number of quick hits to make the tally, we all like to take the meat out of the main trends. Still no sign of that, but that 1410 level is key to a potential bear run.

Hi Connie,

Not familiar with Value Line Analysis, but my pivot points for today showing 1426.

However, as per last two days we had a repeat down up down up session. Before the previous melt down we had these repeat moves which was very visible.Today was the third day.

They were also repeated for 4 days before the meltdown kicked in previously at the start of March.

I'm guessing we are going to have a repeat down up down up -> and then another big meltdown either tomorrow 4th day or on Friday.

Bernanke's speak steadied the market but in all honesty I think he was waffling. Same old speel nothing new. He mentioned inflation but I don't believe his words until I see action. He virtually said he did not like to give clues about monetary policy or which way interest rates will move to the markets. I thought the whole idea was to communicate monetary policy as guidance.

Either way I feel that 10% correction is still on the way. I had 1320 +/- regions too, along with BTD. Very confident (75%) we are likely to see it in the next few days.
 
Atilla said:
Not familiar with Value Line Analysis, but my pivot points for today showing 1426.
It passed through 1426 quickly after the open and never touched it again in this trading session. How is that a pivot point?

Even if you just take a visual on 'where the action happened' you get close to 1420. Just draw a line where the action is equally balanced (forget Vol/OI) and you'll come to the same value.

The problem with most 'standard' pivot point calculations is that they make no use of open interest/volume.

Market Profile also suffers from this same myopia.

You need to know where most players were taking a position: either opening or closing - and you need to factor volume/OI to do this.

Tell me Atilla, with your pivot point showing 1426 how did that help you trade today, or will it help you tomorrow?

If it didn't and or doesn't - get rid of it.
 
Connie Brown said:
It passed through 1426 quickly after the open and never touched it again in this trading session. How is that a pivot point?

Even if you just take a visual on 'where the action happened' you get close to 1420. Just draw a line where the action is equally balanced (forget Vol/OI) and you'll come to the same value.

The problem with most 'standard' pivot point calculations is that they make no use of open interest/volume.

Market Profile also suffers from this same myopia.

You need to know where most players were taking a position: either opening or closing - and you need to factor volume/OI to do this.

Tell me Atilla, with your pivot point showing 1426 how did that help you trade today, or will it help you tomorrow?

If it didn't and or doesn't - get rid of it.

I don't really use Pivot Points. I only started looking at them once in a while for support and resistance lines. I much prefer to use my own SARs.

I essentially use BBand breakouts and MA crossovers. Try to stick to the correct side of my MAs during a move basically. I also use Fib retrace after extended moves to guestimate pull backs.

Here is my hourly chart showing the down up down up move today which is what I'm expecting to repeat tomorrow. I'm not too good with TA still learning... I also look up the standard MACD, RSI & Stochastics... Very much basic text book style.

By the way CMC software works them out for me automatically. I use (H+L+C+Today O)/4
 

Attachments

  • PivotPoints.gif
    PivotPoints.gif
    37 KB · Views: 242
Hi At,
Have you tried adaptive rsi. I found the usuals ie MACD, MAs etc certainly have their limitations.
With ad rsi I am not even looking for a short just at the moment.
 
Pat494 said:
Hi At,
Have you tried adaptive rsi. I found the usuals ie MACD, MAs etc certainly have their limitations.
With ad rsi I am not even looking for a short just at the moment.

Hi Pat494,

I do use RSI but don't seem to have Adaptive RSI on my selection of indicators.

SPX looks like it's breaking out of it's downtrend line on the hourly charts. Still not clear on the day but I'm expecting down for starters. I have 1412 + 1406 on my target list. Last three days have been good. If we have a repeat today it will be a mark for a bigger down wave imo.

Which time charts do you use or are looking at? 4, 3 & 2 hour charts looking like possible buys but rest like hourly and daily ones showing sell to me. I'm bearish over all with some caution. Will decide near trading times.
 
Atilla said:
Hi Pat494,

I do use RSI but don't seem to have Adaptive RSI on my selection of indicators.

SPX looks like it's breaking out of it's downtrend line on the hourly charts. Still not clear on the day but I'm expecting down for starters. I have 1412 + 1406 on my target list. Last three days have been good. If we have a repeat today it will be a mark for a bigger down wave imo.

Which time charts do you use or are looking at? 4, 3 & 2 hour charts looking like possible buys but rest like hourly and daily ones showing sell to me. I'm bearish over all with some caution. Will decide near trading times.
Hi,
Being a cheapskate I use the free data from BBC2 teletext. If you have Metastock I can PM the formula to you. Its far from perfect but better than normal RSI I think. I ought to learn how to post charts so I could show current position.
 
This time, The green line is yesterday's BBC2 teletext , the red line the Ad RSI and the blue lines are a sort of Bollinger Band
 

Attachments

  • Ad RSI.jpg
    Ad RSI.jpg
    202.7 KB · Views: 153
Pat494 said:
Oooops wrong file
:eek:

Nice one :D

I have MetaStock v10 but still not 100% with it. Need to read more boring books.

However, CMC have a create your own indicator ability so yes please if you can post me the formula I'll try it out.

Many thanks.
 
Looks like SPX may turn up with those jobless stats.

Watching it carefuly. This may well be an opportunity to short again.
 

Attachments

  • SPX-070329.gif
    SPX-070329.gif
    33.2 KB · Views: 168
As long as its still below the last lesser delta point of 1431, there's every chance of it going below the 1414 low as per delta rules...Above 1431 then a higher frame has come in early via an a-b point.
 
Top