You are using an out of date browser. It may not display this or other websites correctly.
You should upgrade or use an alternative browser.
You should upgrade or use an alternative browser.
Atilla
Legendary member
- Messages
- 21,079
- Likes
- 4,261
pssonice said:DOW 12360 targeting 12400
Dow 12337 on my screen. 600-700 lot of catching up to do.
Unless 12500 is breached not worth considering going long on Dow imo. Might be a H&S reversal in the making but prefer to wait and see.
Bearish at the mo.
Once again, inflationary pressures with jobless claims falling, oil rising inflationary pressures in the economy coupled with slowing housing.
Despite the good jobless figures and a small rise the current fall is a bad indication for the bulls imo.
Housing slump will spill over to other areas. It's the liquidity that's causing the inflation and with the falling housing this will have a negative multiplier affect. You either have to pump more money in - reduce rates, stimulate housing and liquidity or accept the down turn. Tough call.
Stagflation I hear in the distance drums...
Dow = 12331 now... Direction is down.
To day is day 2 ( green coloured line) on the 4 day cycle..
The normal rotation on is a 3 point low, high, low.....
These type of days often produce quite a high retracement or a double top in the lunch hour delta point window....
5min ES doodle 😱 :?:
EDIT looks like I'll have to draw an a-b in 😱
The normal rotation on is a 3 point low, high, low.....
These type of days often produce quite a high retracement or a double top in the lunch hour delta point window....
5min ES doodle 😱 :?:
EDIT looks like I'll have to draw an a-b in 😱
Attachments
Last edited:
Atilla
Legendary member
- Messages
- 21,079
- Likes
- 4,261
Bez said:To day is day 2 ( green coloured line) on the 4 day cycle..
The normal rotation on is a 3 point low, high, low.....
These type of days often produce quite a high retracement or a double top in the lunch hour delta point window....
5min ES doodle 😱 :?:
EDIT looks like I'll have to draw an a-b in 😱
Hi Bez,
I'm looking at my hourly charts and I see;
1. downward move to 16:00 (GMT) ( Your prediction dead on target to the minute)
2. upward move to 17:00
3. downard move so far.
4. expecting an upward move towards close... 21:00
If this pattern holds I'm thinking tomorrow will be a very scary day as it will have been the fourth day of repetition. I'm thinking this is very similar to previous meltdown.
I thinking of opening a bigger position tomorrow just to satisfy my curiousity. 🙄 😛
Update on that intraday delta rotation...
I just run a double check on my software on why it favoured a normal instead of an a-b point....with harry hind sight the odds favoured the a-b due to a higher frame coming in with throw over point...Any way at least it nailed the direction of the traingle break out 😱
I just run a double check on my software on why it favoured a normal instead of an a-b point....with harry hind sight the odds favoured the a-b due to a higher frame coming in with throw over point...Any way at least it nailed the direction of the traingle break out 😱
Attachments
Buy The Dips
Member
- Messages
- 70
- Likes
- 2
watching April 2 as next turn date low
then strong rally into April 6
then strong rally into April 6
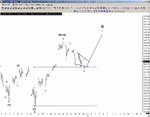
The pattern feels like an ED to finish of a lesser "C" wave.
So either late tommorrow or early doors monday the turn is due....
larger pattern looks like a Zig-Zag B :?: (alt is a LD wave 1 of a C but that has lesser odds)
So we Should get one last sell point either very late tonight or early tomorrow as long as the price stays below 1426 to complete the 5 waves.
Attachments
Last edited:
Atilla
Legendary member
- Messages
- 21,079
- Likes
- 4,261
Bez said:Yes I was looking at those dates myself...🙂
The intraday point is due any time between now & 15:00 (est) but it could get a late throw..... By the way those a-b points are very common in the morning session of green days ( cycle day 2)..
This is the same repeating pattern for the last 4 days...
Forgive me for the basic diagram but it higlights the moves clearly.
Not sure where we will be by closing time 9pm GMT but I'm guessing up from 6pm.
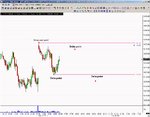
Also, the H&S reversal from the meltdown seems to have reached it's full retrace. Perhaps we will see a little bounce resistance from the MA55 only to make a lower high up to 1430 before the next big move down.
Perhaps my times are wrong but after this move I strongly suspect a big move down. I don't consider my analysis anything meaningful other than a pattern from previous SPX moves but all your comments seem to point to a similar action of a big drop down.
I think the move may well be tomorrow and will open a short position at an opportune moment. I always get bad vibes about Friday given the weekend is round the corner.
DOW is down too so can't be good despite the good jobless numbers. Ominous eerie feeling about the markets. Kinda spooky. Or is it just me... 🙄 😛
Attachments
On your second chart , the swing high (1334area) is higher than the last swing high around 1406.. That means a higher frame is in play as each high has gone higher...
At the moment I'm not seeing a pattern that is looking like a "sky fall in or fall off a cliff "C wave move down. The pattern looks to corrective...
Might be just me though 🙂))
At the moment I'm not seeing a pattern that is looking like a "sky fall in or fall off a cliff "C wave move down. The pattern looks to corrective...
Might be just me though 🙂))
Bez said:On your second chart , the swing high (1334area) is higher than the last swing high around 1406.. That means a higher frame is in play as each high has gone higher...
At the moment I'm not seeing a pattern that is looking like a "sky fall in or fall off a cliff "C wave move down. The pattern looks to corrective...
Might be just me though 🙂))
The pullback is 4d and pretty steady (not a steep fall) so yes appears corrective to me too... technically.
But like everyone else I see the Geopolitics and think 🙁
It'll be interesting to see how this "hostage" crisis plays out.........
Nice analysis as always Bez - I always check in when around 😀
Thanks HS 🙂
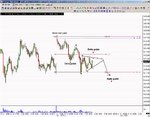
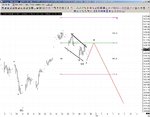
This is the only pattern I can see that would produce a catastrophic wave 3 of a C wave to take us to new lows...
In order for it to come into play it needs to go higher than the last swing high of 1326 to change degree for a wave II, it needs to hit at least the 61.8% at 1329 to do the most technical damage in order to take out the 1363 lows that Altila would like for his friday feeling 😉 🙂
But while we stay below 1326 it favours the simple corrective count with a small move down tomorrow to finish of this corrective pattern around 1310-08 area...
Attachments
Chocolate
Member
- Messages
- 88
- Likes
- 1
So it's up for the first 15 minutes on the DOW tomorrow till 14:45GMT, perhaps a second high at 15:45GMT down for the rest of the day, up for the whole of next week and down for the rest of the year...sounds good to me.
I was initially thinking that this Monday's top might stick and this was just a slowly-slowly decline unfolding so that it's already happened before anyone notices (and I'm not even short at the moment!), but the massive strength of for example the DAX (which despite the DOW declining today, hardly gave back any gains and is now almost at tops again) makes me doubt that original thought and favour yours.
What pivot time-wise are you starting from to get April 2nd and 6th as delta points (the first low? or the all-time high?) or is it more complicated than that?
The DOW is really lagging at the moment - it's still well below its 50MA on the daily chart while most other indices just bounced up from their 50MA's today. It is very curious...usually the big chips are strong when markets are nervous. I think it was also lagging a bit in the weeks before the mini-correction (at least I had that impression) but it had an excuse then...the oil price was low which I'm sure small companies love while big oil giants in the DOW suffer.
Any ideas on the great big v small debate? :idea: :?:
Last edited:
Atilla
Legendary member
- Messages
- 21,079
- Likes
- 4,261
Connie Brown said:The 1420 level is still providing a locus for price action. What I stressed yesterday was to pay attention to what was happening with OI. If you look at the front month there is clear indication that although the index got a higher high than yesterday, the futures were definitely more attracted to the lower low.
I'm not too much of a fan on micro-analysis of the divergence between the index and the front month on an intraday level, but the signs were so clear today that the leakage into the next 5/6 trading days will be significant.
With the holiday coming up those who stick rigidly to their cycles are going to have a hard time reconciling trading time with clock time.
My money is still, quite literally, on the bear side and I am still looking hard to see what action develops around the pivotal 1410 level.
Good day everyone,
Just thinking about SPX and nice move up in the last hour to 1424. I was looking to short so I've taken this opportunity and done the dirty deed.
After the last few days the temptation is too great not to give this a shot... / short... 😆
Similar threads
- Replies
- 5
- Views
- 3K
- Replies
- 36
- Views
- 14K
- Replies
- 1
- Views
- 3K