Trading the SPX

You'll enjoy Wilders writing style :))))

The ES is running at 11 or so point premium to the cash ....

Blue day on the delta cycle day 4 so the rotation goes Low high low... The high being in the lunch period, then the low in the afternoon session. However blue days can have an extra point in the afternoon session...
 
Last edited:
This count would favour the extra delta point version of a Blue cycle day 4 ....
 

Attachments

  • doube 3.jpg
    doube 3.jpg
    186.2 KB · Views: 180
Were in the window for the extra point...

Nice line in the sand the 1445 (ES) if it breaks then the normal rotation is in control....
 

Attachments

  • Blue day.jpg
    Blue day.jpg
    197.3 KB · Views: 179
That will do me :)

I hope these Intraday charts help piece together the Short Term Delta which is ignored in the book, as it was for directors only...
 

Attachments

  • intradaydeltblue.jpg
    intradaydeltblue.jpg
    207.1 KB · Views: 166
Bez said:
That will do me :)

I hope these Intraday charts help piece together the Short Term Delta which is ignored in the book, as it was for directors only...

I've saved and printed your three charts Bez. I've started reading the book and I see what you mean about Wilder's writing style. I've only read about 10 pages so far and it's like a Hollywood BlockBuster movie or something... Not text book style but more like story telling. I'm not sure what to think of it but it has my 100% attention. It is easy to read so far though. I'm reading it with a view to digesting it's contents.

I assume as it is a public circulation book there is no disrespect to the author in discussing it publicly on this site. If anybody feels contrary to this assumption I'll be happy to keep quiet.

You are right the book only comments on Intermediate & long term programs.

Just reading about DMark and Inversion at the moment.

Many thanks for your help and I'll keep you posted on progress if that is ok.
 
The book misses out a ton of info :rolleyes:

But its a starting point for the basic cycle theory....Once you get used to it learn the basic rules about 3 highs in a row, late or early depending on the higher frames ect..Again the book does not go into these rules.. That link BTD put up has the rules laid out quite well on there its well worth printing them out when your mapping points out.

http://babelfish.altavista.com/babe...&url=http://www.247free.org/marketmatrix.html

What's not on the link or Copans CD's, is how important a-b points are on all time frames not just the LTD as Wilder hints at.

Also missed out and its something to be aware of is:
You can only have a maximum of 4 delta points in any coloured line segment! There are normally 3..... but 4 delta points is the most you can have between two coloured lines.


I'll look forward to see how you get on :)
 
Last edited:
Bez said:
You can only have a maximum of 4 delta points in any coloured line segment! There are normally 3..... but 4 delta points is the most you can have between two coloured lines.
Good info Bez, Ive never taken the Matrix course, 11 points has worked well for me but has inversions.

I am told Steve Copans own solution is a fixed 12 ITD points no inversions.

However have done some work lately with a 16 point Delta which is very interesting. :) (4 points between every 2 lines)

16 point ITD "may" be best solution of all. :idea: Gives all the a-b points a number. (will post chart later)
 
Most directors ;) use the 11 point Inter. The inter will always have an Inversion point due to the lunar calander plot. Thats not to say there isn't an alternate inter frame not based on a lunar model ;)

:)
 
Last edited:
Pat494 said:
Nice lookin chart Bez - would it imply a 1430 ish close for today do you think

It did go lower than I would of liked but it means the bears are now committed to the alternate C count...

The only problem I have is, the Lesser Delta time frame which the Inter usually comes in with is not due till the 28th which hints at this correction as a W4 rather than the "sky falling in" C wave the bears are after :?:
 

Attachments

  • bears.jpg
    bears.jpg
    209 KB · Views: 212
Not to bad a day...:)

Delta helped keep us on the right side of the market with the lesser points. Thats one of the reasons I put on last nights chart the possable "tripple 3 "z" wave scenario, as there was a chance of a throw over.

Throw overs often produce sharp moves like this moring as price tries to catch up with time pressure.

Update on that chart....

:?:
 

Attachments

  • lessercount.jpg
    lessercount.jpg
    210.5 KB · Views: 214
Last edited:
Bez said:
Not to bad a day...:)

Delta helped keep us on the right side of the market with the lesser points. Thats one of the reasons I put on last nights chart the possable "tripple 3 "z" wave scenario, as there was a chance of a throw over.

Throw overs often produce sharp moves like this moring as price tries to catch up with time pressure.

Update on that chart....

:?:

Hi everyone,

Decided to go short on SPX at 1432, as I feel it's going to break down out of it's BB.

Also, the Housing news was expected to be positivie and was negative. Housing is the biggest multiplier in the economy and I feel it will spread elsewhere.

My only worry is talk of rate hikes might take SPX higher.

Otherwise feel pretty bearish. On the daily charts too we have made a lower high which adds to my bearish stance.

The Delta book was quite an eye opener. Still trying to digest it. I have tried out the intermediate delta on the FTSE100 and I came up with a 7 turning points. Still not too clear on the inversions. Certainly an eye opener. :)
 
It looks like the SPX is repeating a little of yesterday. Down to 1425 regions only to attempt a bounce back up again.

It's looking very bearish at the mo and I have it going down to 1415 regions sometime soon, today or tomorrow...
 
Decided to go short on SPX at 1432, as I feel it's going to break down out of it's BB.

Also, the Housing news was expected to be positivie and was negative. Housing is the biggest multiplier in the economy and I feel it will spread elsewhere.

Good scalpers shout on spx Atilla.... but on the bearish point - we'll have to wait and see... for a bit anyway.

I see other econ guys are saying the housing thing is pretty serious yet...... 10 yr note is at pbk lows.... granted still high but if housing woes do spread then US bonds must rise (yields fall ) surely ??? That's bonds but ......... should affect indices too....... just a matter of timescale :cheesy:
 
Hook Shot said:
Good scalpers shout on spx Atilla.... but on the bearish point - we'll have to wait and see... for a bit anyway.

I see other econ guys are saying the housing thing is pretty serious yet...... 10 yr note is at pbk lows.... granted still high but if housing woes do spread then US bonds must rise (yields fall ) surely ??? That's bonds but ......... should affect indices too....... just a matter of timescale :cheesy:

Hi HS,

Housing crises will spread imo (95% confident). As I said biggest multiplier in economy. When housing stalls so does everything else - carpets, furniture, white goods, painting decorating, soft furnishing etc etc...

Markets & traders can be funny about rates. Two views to take:

1. Oh the Fed has reduced rates the economy must be worse than expected - sell sell sell
2. Oh the Fed has reduced rates increased profitability and improved earnings - buy buy buy

I don't know which route the SPX will take but I just don't see any milage left in the US economy.

Congress is trying to vote for $99bn more expenditure on war chest otherwise money is going to run out. US still carrying out expensive war games off the gulf and rattling bombs at the Iranians.

Very bad vibes about it all so for me sell sell sell.

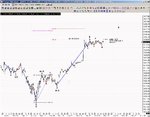
Good day for me on SPX. Took my profits earlier on and just went short again at 28.6. SPX turning again on hourly charts and still below MAs. SL 1430. If it breaches 25 then I'm expecting 1415.
 
Nicely done Atilla, your were ahead of the game..:)

The warning flags started early as the price didn't take out the 1439 level as per delta rules, as each point must go higher than the last, which it clearly did not....
 
Bez said:
Nicely done Atilla, your were ahead of the game..:)

The warning flags started early as the price didn't take out the 1439 level as per delta rules, as each point must go higher than the last, which it clearly did not....

I haven't applied Delta to SPX yet. Still need to read it fully and understand it. SPX call today was based on daily and hourly charts TA.

I have noticed it repeated yesterday somewhat. Perhaps too early to say but be watching it closely tomorrow and if it repeats it 3 and 4 times it will be pretty much the same kind of intraday movements before the big downward move. Traders must be creators of habit or the Order of the markets are in play.

Downward move struggling at the mo. Just considering closing pos and calling it a day.
 
Hi everyone,

This is amazing. Watched the pos for a while not much happened. Just watched CSI and a bit of news to come back to an absolute suprise.

Oil at $66. SPX at 1425. Missed 1420 levels. But I have now closed full pos. Not sure why oil has gone through the roof.

I suppose people are now taking escallation in gulf more seriously. So am I. Gold has now touched $666 and $670 only a matter of time.

If the Delta Phenomenon is correct failure of a turn not to make an orderly rise or a turn is an indication of severe market conditions.

Will review news and possibly place another short. Will see how Asian session response. Would prefer to sleep well and re consider tomorrow.

Interesting times....
 
Top