Trading the SPX

  • Thread starter Thread starter wasp
  • Start date Start date
  • Watchers Watchers 82
Hi everyone,

Any clues on the SPX direction for monday?

I see some kind of consolidation with intraday action getting slower...but, having said that, I think they may attempt another leg down to 1365-70. Don't see any conviction on the buyers side. We need a really quiet, low volume day to end this bottoming process...

Andre
 
connect jan 04 and jul 06 his and that bull market,we broke above it in oct and now came back to it,it is struggling on that line which is about 1390 on the cash,until the bulls or bears take charge, it seems to be a magnet,very hard to trade wiyhout a trend,so don't trade without a setup,the monthly macd is still way oversold,what do your stochastics tell you
 
That's true: the last three trading days were difficult : now I am on the sidelines until I see a very quiet, flat or up day; the bottoming process is not over. The institutions need a real reason to dump shares and it isn't happening yet. . so I imagine, we'll have another move up sooner or later..
Andre
 
My indices show a very weak buy signal since thursday ..but,of course, this may change tomorrow if they
decide to take them lower
Andre
 
Seems to favour a move higher into the FED..:?:

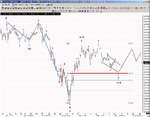
A closer look at the 10min degree....

So a move down to finish the ending diagonal c of the wave 2 on the chart... in the early part of tomorrows trade (1381+/- area looks a nice bullseye).... then up into the FED on Wednesday...

🙂 :?:

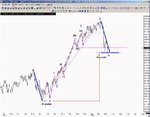
I've also added a Daily chart of the OEX, (the top 100 of the S&P500) as it hit its alternate wave support...
 

Attachments

  • 10mindegree.jpg
    10mindegree.jpg
    207.5 KB · Views: 183
  • OEX.jpg
    OEX.jpg
    200.5 KB · Views: 150
Last edited:
Bez said:
Seems to favour a move higher into the FED..:?:

A closer look at the 10min degree....

So a move down to finish the ending diagonal c of the wave 2 on the chart... in the early part of tomorrows trade (1381+/- area looks a nice bullseye).... then up into the FED on Wednesday...

🙂 :?:

I've also added a Daily chart of the OEX, (the top 100 of the S&P500) as it hit its alternate wave support...

On my charts using SARs and Fib, I have it dropping to 1376 before getting some support.

On my daily charts I have a bounce coming up but don't know when. Might go up to 1420-30 max and then a big mighty fall again...
 
Keeping an eye on today as a possible top. Delta suggests ITD and si-td could both top this morning (or maybe Wednesday) and then get slammed into end of week.

This week is the SITD anniversary of the Feb 22 top

sitdeq7.png
 
Wednesday (21st) the SITD is due...hence why I was saying up into the FED 😱

🙂
 
I'm not sure this is going to tank....

I probably sound like FC 🙂))....but the higher frame delta could very well be hinting at higher prices...

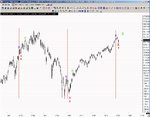
A chart showing where we are in the 4 year seasonal long delta....
 

Attachments

  • longterm.jpg
    longterm.jpg
    188.2 KB · Views: 186
Last edited:
Bez said:
Wednesday (21st) the SITD is due...hence why I was saying up into the FED 😱

🙂

Yep, Im thinking it may come early due to weak market? (Hurst 20 week lows are just days away due between 3-23 and 3-28)

I think this rally should fizzle somewhere in here per chart Friday.....

cwaveiy4.png
 
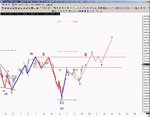
Is this the Inv H&S you are looking at ammo :?:
 

Attachments

  • inv h&S.jpg
    inv h&S.jpg
    202 KB · Views: 348
Just out of interest did anyone manage to pick the S&p futs up last night before midnight (UK) when they fell with the $/Y ?

You could have bought them at Friday's lows......... I was short at the close friday and was so relieved to be bailed out... I only took a half position - small smiley
 
I was keeping a close eye on the futs at over 4 points down early on as It finished of that lesser C wave 😱 Didn't buy it as I only trade during normal market hours...🙁 🙂
 
roguetrader said:
Vols very light for a big up day, not much conviction. SOX not happy either.

Did somebody mention diamond top on this thread sometime back.

That's what I'm seeing at the moment on weekly and daily charts.

According to Bulkowski it's likely to continue back down once we reach the end of it sometime tomorrow 21st of March... Hmmm.
 
Gann 2x1 off Feb highs is coming down to 1409.50 today, 1407.50 tomorrow etc. and should prove very tough resistance for rallies.

Fed day does look like the top and then probable roll over into late March Delta ITD MTD cluster.

mtdzh3.png
 
Back
Top