Trading the SPX

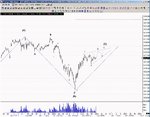
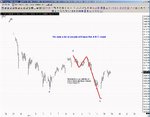
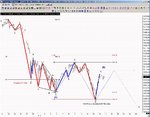
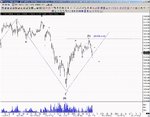
Bez and BuyTheDips, your posts are totally amazing, though I must admit I don't know much of the terminology you use. I'm in two minds myself as to which way we're going from now till the close - I have a small long on at present from 12159 which wasn't a great entry and I might exit if it doesn't break up in the next few minutes.

edit: looks like I chose the wrong time to trade intraday so out at b/e...also realized I'm posting in the wrong thread, but SPX and DOW behave pretty much the same anyway.
 
Last edited:
Any thoughts on one of these messy ED's as the C :?:
 

Attachments

  • ed.jpg
    ed.jpg
    207 KB · Views: 205
I'm not very up on the strict rules for the ABC of Elliott wave, but what do you think of the possibility that today was day one of a 7-day up-leg in the markets to squeeze out shorts? (So I guess this would be a wave (B), wave (A) being the 16 or so days down to this Wednesday's low.)

Even if this doesn't transpire, I'm basically asking why can't wave (C) in your chart be above (A), as an up-down-up (up correction) to the initial down move sparked off a fortnight ago?
 
Thanks for the kind words Chocolate :eek: :)

I'm sure a lot are labeling this move as a Basic A-B-C into the larger 38.2% support which I think your hinting at :?:. The thing that bothers me, is the shape move down was only a 3 wave move & C waves must be made up of 5 waves...

:?:
 

Attachments

  • simple abc.jpg
    simple abc.jpg
    187.8 KB · Views: 194
Last edited:
A closer look at the 30min structure :?:
 

Attachments

  • closerlook.jpg
    closerlook.jpg
    225.9 KB · Views: 178
Last edited:
Bez said:
A closer look at the 30min structure :?:

Interesting!!!!!!!!!

(1) projected low in the 7th anniversary window
(2) prospective low corresponds to length of the summer slide ( circa 107/108pts)

Mmmmmmmm! :D
 
Bez said:
A closer look at the 30min structure :?:
No, thank you for being so helpful :) Thinking about it, I see this is wave B of our "correction", but wave B (which looks a bit like a slanted N at the moment) could be an expanded triangle thingy if it wanted to, getting up to 1418 or so, or is this not allowed? To hurt the shorters I do feel it would be likely to break 1410 if it possibly can... , the present wave C of our wave (B) going up-down-up with the third up covering the same ground as the first. edit: but that would be only three waves again, so if this is going to be five waves it's going to be lasting for at least the next week or so? Consolidating above that 1410 mark in a week's time, any shorters would be seriously concerned (I know I would be) Could this not be the perfect time for wave C to commence?

I just noticed that the long-term chart is an expanding triangle with bottom part falling, top part horizontal, exactly the same as we have in the 5-min chart for today - the difference is that today we were approaching from below whereas in the big picture we are approaching from above.
 
Last edited:
Bez said:
Thanks for the kind words Chocolate :eek: :)

I'm sure a lot are labeling this move as a Basic A-B-C into the larger 38.2% support which I think your hinting at :?:. The thing that bothers me, is the shape move down was only a 3 wave move & C waves must be made up of 5 waves...

:?:
On much more simple T/A terms, notice the head and shoulders pattern here, which is a reverse pattern...and this was in an uptrend so the big could have been predicted-i guess
 
Hi everyone,

Today I'm guestimating we will have a downward move to at least 1375 levels and depending whether it holds or not either further down ward move or depending on stats some further sidewards move in the 80s or 90s regions.

Next week I think we may have a pull back above 1400s if these 90s level hold.

The CPI and industrial stats indicate seismic moves. I think the Fed's got to raise interest rates if CPI is high but doubt they will in current election / economy climate.
 
Buy The Dips said:
No real opinion today.....we broke the 6x1 downtrend which is short term bullish. Today has some bullish cycles and could stop here or short squeeze to 1410-1419....things look like a wildcard.

Here are the possible Fib times to watch today into that 2:37 time projected from 3-14-2007.......So far the 10:02am and 10:17am have worked.

These are rounded off into the 5 min bars and not exact.....just for entertainment purposes only :) :p

fibs2xj8.png


Edit: Added 1:12pm

Thank you for the info BTD,

The drop hasn't materialised for me but I thought it might hover in the 1390-1400. Perhaps I got the order wrong as it seems to be dropping a little now.

I'll be following the reversals on your spreadsheet to see how they pan out. Really interested to see how these numbers are obtained but still waiting for my book.

Once again many thanks. :)
 
EW doodle on the 10min ES :?:

Both bear & bull cases...
 

Attachments

  • doodlejpg.jpg
    doodlejpg.jpg
    215.5 KB · Views: 145
  • bull doodle.jpg
    bull doodle.jpg
    203.4 KB · Views: 145
Last edited:
Day day in an orange day ( day 1 on the 4 day cycle)Normal order goes should be low High low....

We had the throw over delta point this morning so the rotation fits a Low High Low .....However we can have an extra point on day around the lunch hour.

The easy way to look at inversion days is to draw the letter A on the chart ( flip it upside down if the rotation is down), The horizontal line of the A represents the inversion window during lunch. If we get a high point in the window the odds greatly favour an low point to follow in the afternoon or conversely if we get a low point during the window the odds favour a move up in the afternoon session.
 

Attachments

  • delta1.jpg
    delta1.jpg
    191.8 KB · Views: 173
  • delata3.jpg
    delata3.jpg
    206 KB · Views: 158
Update on that intraday chart..

Notice the 21 bar up move into lunch....
 

Attachments

  • PW223259-32.jpg
    PW223259-32.jpg
    209.5 KB · Views: 177
Remember this post...:?:

Bez said:
:I have Friday (16th) as the lesser delta frame point which the Inter could come in with..:)

I didn't think the a-b points would be so strong but the 16th was the earliest date the inter could come in with .. :?:
 
It re balancing time in the S&P so the last half hour will be interesting.....As the Bots fight it out on re-weighting allocations...
 
Could well be, I put a 1,2 count on one of the charts some where :eek: :)

Nice work on the timing :!: Notice the 55 bar move down from the high this morning...:?: They can do what they want now, I'm not doing battle with the Bots ...:))
 
I like the idea of the crash which dc2000 was predicting for today to happen Monday. The Elliot wave stuff doesn't seem to support this though as I understand it...or maybe it does if Bez's "bearish" chart in post 1272 is actually what transpired...it did a bit of a jig both up and down so it could be either. "Delta points" are what I was calling "pivots of time" I see! :D

Atilla said:
Whilst I agree gold is going up and is likely to continue upon the weakness of the $ and potential confrontation between Iran and US, I would watch the Democrats opposing the Republicans closely.

Any indication the US will call off the attack will mean gold may retreat briefly.

Otherwise I'm in long and deep with a stop loss at 635. I've got my sights at 660-700. 670. Will take gradual profits until 700. May re-enter if 710 is breached.

I'd guess March is going to be a rough time for the markets. Time for bear picnics...

(from the Gold thread) Phrophetic!!! :!:
 
Last edited:
Chocolate said:
I like the idea of the crash which dc2000 was predicting for today to happen Monday. The Elliot wave stuff doesn't seem to support this though as I understand it...or maybe it does if Bez's "bearish" chart in post 1272 is actually what transpired...it did a bit of a jig both up and down so it could be either. "Delta points" are what I was calling "pivots of time" I see! :D


(from the Gold thread) Phrophetic!!! :!:

Thank you Chocolate,

It's nice to get them right once in a while. I got on board gold as soon as I heard the air crat carrier was leaving the US for the gulf at 608 and was in most of the way until I got shaken out around 658. Gold did touch 680 but the volatility got too much for the old ticker and I now lost my nerve. Last two weeks I got the moves fairly right but not in the market anymore. Just watching and waiting.

I follow and trade in SPX, Cable, Gold and sometimes Oil. Coupled with news, inflation and interest rates I feel I have a handle on the fundamentals.

I really need to hot up the Technical Analysis more than I know. When the FA and TA support each other the power of the force is over whelming...

On the SPX I think we are going to see a pull back next week though as the 1390s have been touched and the 1380s held. Perhaps up to 1405 regions until another big correction drop to 1320s sooner or later.

Have a great weekend...
 
Cover your shorts and race to the top

Total commercial COT data has moved from very short to essentially net flat.
 
Last edited:
Top