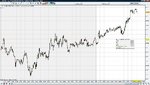
Trading Naked - Part 2

Bad time of day but still using my free acount and I'm a great believer in practice making perfect re. trading this way. Blue for entry and red for stop.

gbpusd - 091105 m5g.gif

All the best

Rob

P.S. Note the double bottom off the SbRbS level at 6558
 
Last edited:
Morning everyone,

eurjpy 091106 m5 a.gif

Here's one I'm trying on demo. Blue line for entry, red for stop and green for TP level for half the trade (if it gets there).

All the best

Rob
 
Last edited:
Cable seems to be having one of those 'will she, won't she' type of mornings. Not a great setup IMO as, whilst the level is very obvious, the trade will be be straight into resistance.....

gbpusd - 091106 m5 a.gif

All the best

Rob
 
Look at it on the hourlies, touching 16624 every time since 5am, don't see that too often.

Don't know whether to take it or not, there's a very good chance that it will break, pull back just enough to stop out most and then go. If in doubt stay out i think.
 
Had to be quick with cable. M1 tells the story, break and retest of the level, with stop straight to below the level, and then out for a small loss. Flat now until after the news.

Yup tried the same thing, out +1.
 
Updte on EURJPY.

eurjpy 091106 m5 b.gif

Kicking myself that I didn't have my TP level a little lower but not much I can do about it now.

If anyone is interested, I'm trying a little psychological experiment on myself to see if, by looking at 2 or 3 more pairs, I can help myself avoid getting into some of the cable trades I should be avoiding. Whilst in no way am I selective at all in what levels I'll take, it's all too easy for my mind to start inventing 'levels' that don't exist and zoning in on price in a little too much detail I think.

Ultimately the peaks and troughs which I use for defining which levels to hit are all easily identifiable on M15 - I just much prefer M5 to see what's going on, but thedownside to M5 is that it throws up loads more potential opportunities.

As an aside, and I'm not sure how important this is or not, but if I turn a chart on and quickly look at it for 5 seconds I'll tend to pick the right levels to trade. EURJPY being a good example. The problem I seem to have with staring at cable all day is that my mind starts playing tricks with me.
 
Update on EURJPY. Just been having a look at that chart again and have moved my TP down to where it possibly should have been in the first place and also placed a buy order above that level so I can load up a little.....

eurjpy 091106 m5 c.gif
 
Updte on EURJPY.

View attachment 67748

Kicking myself that I didn't have my TP level a little lower but not much I can do about it now.

If anyone is interested, I'm trying a little psychological experiment on myself to see if, by looking at 2 or 3 more pairs, I can help myself avoid getting into some of the cable trades I should be avoiding. Whilst in no way am I selective at all in what levels I'll take, it's all too easy for my mind to start inventing 'levels' that don't exist and zoning in on price in a little too much detail I think.

Ultimately the peaks and troughs which I use for defining which levels to hit are all easily identifiable on M15 - I just much prefer M5 to see what's going on, but thedownside to M5 is that it throws up loads more potential opportunities.

As an aside, and I'm not sure how important this is or not, but if I turn a chart on and quickly look at it for 5 seconds I'll tend to pick the right levels to trade. EURJPY being a good example. The problem I seem to have with staring at cable all day is that my mind starts playing tricks with me.


staring at cable all day is that my mind starts playing tricks with me

Hi Kitejet,
The problem you highlighted above is one I am familiar with and I am sure others are too.
I find the only way to cope with this is by only watching hourly candles. I turn on my computer at 7 am, note the prices of the pairs I am interested in, then turn 0ff my machine and analyse, get my alerts ready etc. Ig have a good alert service that can alert you to your mobile.
I have found that leaving the computer on all day gives one such a bad headache and makes the brain go mushy.
 
Morning everyone,

Here's one I'm trying on demo. Blue line for entry, red for stop and green for TP level for half the trade (if it gets there).

All the best

Rob

Here's one I'm keeping an eye on. AUD/USD, overall trend is up, this level could be quite a good opportunity to get in with a very nice R:R. First chart is 4h, second is 5m, got an order in just above 9180.
 

Attachments

  • AUDUSD2.jpg
    AUDUSD2.jpg
    185.1 KB · Views: 173
  • AUDUSD1.jpg
    AUDUSD1.jpg
    214.1 KB · Views: 176
staring at cable all day is that my mind starts playing tricks with me

Hi Kitejet,
The problem you highlighted above is one I am familiar with and I am sure others are too.
I find the only way to cope with this is by only watching hourly candles. I turn on my computer at 7 am, note the prices of the pairs I am interested in, then turn 0ff my machine and analyse, get my alerts ready etc. Ig have a good alert service that can alert you to your mobile.
I have found that leaving the computer on all day gives one such a bad headache and makes the brain go mushy.

Hi Gamma,

I guess that is one of the problems with lower timeframes, in that one is prone to get too caught up in every pip of price movement and miss the bigger picture, in terms of the levels which really matter.

All the best

Rob
 
Here's another one I'm running with. Nice M5 trend up into what looks to me like a pretty decent RbSbR level. As before, blue for entry, red for stop and green for TP level.

gbpjpy - 091106 m5 a.gif

I'm running these as I do cable with 2 positions at the start with half being taken off at the TP level and leaving options open to load up at these points as well.
 
Hmmm - slightly frustrating time with EURJPY and have given back most of the profit from the first entry to the second one.

eurjpy - 091106 m5 c.gif
 
Here's an M1 chart of that last move with stop placement. Always frustrating when they fizzle out, and this one will probably now reverse and shoot for the stars!!!

gbpusd - 091106 m5 c.gif
 
Euro consolidating below it's intraday high, following a nice 1-2-3 long. Trading the break might require some fast stop moving as there is resistance at 4917 on my chart and price could bounce there.

eurusd - 091106 m5 a.gif

Plan B might be to look for a lower high to form below the current level at 4905 and then look for a short set-up.
 
Top