Trading ES (Q1 2004)

Also m8

One more question. I assume housing stocks also have a beta in relation to the FTSE. Is that beta showing any weakness. Thinking about moving house.

Cheers
Andy
 
Found this on beta's for the peeps who are not rocket scientists.

Beta is the sensitivity of a stock's returns to the returns on some market index (e.g., S&P 500). Beta values can be roughly characterized as follows:


b less than 0
Negative beta is possible but not likely. People thought gold stocks should have negative betas but that hasn't been true.
b equal to 0
Cash under your mattress, assuming no inflation
beta between 0 and 1
Low-volatility investments (e.g., utility stocks)
b equal to 1
Matching the index (e.g., for the S&P 500, an index fund)
b greater than 1
Anything more volatile than the index (e.g., small cap. funds)
b much greater than 1 (tending toward infinity)
Impossible, because the stock would be expected to go to zero on any market decline. 2-3 is probably as high as you will get.
More interesting is the idea that securities MAY have different betas in up and down markets. Forbes used to (and may still) rate mutual funds for bull and bear market performance.

Alpha is a measure of residual risk (sometimes called "selecting risk") of an investment relative to some market index. For all the gory details on Alpha, please see a book on technical analysis.

Here is an example showing the inner details of the beta calculation process:

Suppose we collected end-of-the-month prices and any dividends for a stock and the S&P 500 index for 61 months (0..60). We need n + 1 price observations to calculate n holding period returns, so since we would like to index the returns as 1..60, the prices are indexed 0..60. Also, professional beta services use monthly data over a five year period.

Now, calculate monthly holding period returns using the prices and dividends. For example, the return for month 2 will be calculated as:

r_2 = ( p_2 - p_1 + d_2 ) / p_1

Here r denotes return, p denotes price, and d denotes dividend. The following table of monthly data may help in visualizing the process. (Monthly data is preferred in the profession because investors' horizons are said to be monthly.)

Nr. Date Price Div.(*) Return
0 12/31/86 45.20 0.00 --
1 01/31/87 47.00 0.00 0.0398
2 02/28/87 46.75 0.30 0.0011
. ... ... ... ...
59 11/30/91 46.75 0.30 0.0011
60 12/31/91 48.00 0.00 0.0267


(*) Dividend refers to the dividend paid during the period. They are assumed to be paid on the date. For example, the dividend of 0.30 could have been paid between 02/01/87 and 02/28/87, but is assumed to be paid on 02/28/87.
So now we'll have a series of 60 returns on the stock and the index (1...61). Plot the returns on a graph and fit the best-fit line (visually or using some least squares process):


| * /
stock | * * */ *
returns| * * / *
| * / *
| * /* * *
| / * *
| / *
|
|
+------------------------- index returns


The slope of the line is Beta. Merrill Lynch, Wells Fargo, and others use a very similar process (they differ in which index they use and in some econometric nuances).
Now what does Beta mean? A lot of disservice has been done to Beta in the popular press because of trying to simplify the concept. A beta of 1.5 does not mean that is the market goes up by 10 points, the stock will go up by 15 points. It doesn't even mean that if the market has a return (over some period, say a month) of 2%, the stock will have a return of 3%. To understand Beta, look at the equation of the line we just fitted:

stock return = alpha + beta * index return

Technically speaking, alpha is the intercept in the estimation model. It is expected to be equal to risk-free rate times (1 - beta). But it is best ignored by most people. In another (very similar equation) the intercept, which is also called alpha, is a measure of superior performance.

Therefore, by computing the derivative, we can write:
Change in stock return = beta * change in index return

So, truly and technically speaking, if the market return is 2% above its mean, the stock return would be 3% above its mean, if the stock beta is 1.5.

One shot at interpreting beta is the following. On a day the (S&P-type) market index goes up by 1%, a stock with beta of 1.5 will go up by 1.5% + epsilon. Thus it won't go up by exactly 1.5%, but by something different.

The good thing is that the epsilon values for different stocks are guaranteed to be uncorrelated with each other. Hence in a diversified portfolio, you can expect all the epsilons (of different stocks) to cancel out. Thus if you hold a diversified portfolio, the beta of a stock characterizes that stock's response to fluctuations in the market portfolio.

So in a diversified portfolio, the beta of stock X is a good summary of its risk properties with respect to the "systematic risk", which is fluctuations in the market index. A stock with high beta responds strongly to variations in the market, and a stock with low beta is relatively insensitive to variations in the market.

E.g. if you had a portfolio of beta 1.2, and decided to add a stock with beta 1.5, then you know that you are slightly increasing the riskiness (and average return) of your portfolio. This conclusion is reached by merely comparing two numbers (1.2 and 1.5). That parsimony of computation is the major contribution of the notion of "beta". Conversely if you got cold feet about the variability of your beta = 1.2 portfolio, you could augment it with a few companies with beta less than 1.

If you had wished to figure such conclusions without the notion of beta, you would have had to deal with large covariance matrices and nontrivial computations
 
China

This is probably a really stupid question. If you take two stocks with similar beta's. If during the intra day session, these two stocks deviate from their beta comfort zones, should we expect them to snap back. Would this also be a heads up.

Andy
 
Andy,

Don't know what the breakout levels are for A and C. MBF supply 'em on a daily basis for anyone that's that interested but, since it's based on a percentage of the last 30 days ranges it's something that you can work out for yourself if you are that enthused ;). Their actual method is more complicated because it takes into account other markets in calculating the breakout levels for the S&P. That's only common sense if you think about it since volatility tends to roll from one market onto another round the world across currencies and interest rate markets as well as equities.

Anyway, I'm not that enthused about it. As I said before, opening range breakout methods only come into their own if you trade a whole range of markets right across the board. You really do have to be prepared to kiss a lot of frogs before you find a princess.

In terms of the opening range itself. Fisher makes the point that the period you use for the opening range depends on the time-frame you use for trading, i.e. first two weeks of the year, first 2 hours of the month, etc..... (I include this for other peoples reference, since I know you've already watched his presentation).

When your outlook is as short-term as ours and we only trade one particular market or type of market i.e. stock index futures, imo we have to be a bit smarter in how we think about the opening range. Rather than fixing it in our minds as being 1/5/10/60 minutes long we have to think about the process.

Btw, this is particularly important as the S&P isn't a "natural" commodity. Once the cash market opens up fully then cash is, as we've all discussed may times, king. It's also worth remembering that some of the specialists wait to see what happens in the futures open before they open up the cash.

Anyway, the open is a price discovery/auction process. A large percentage of the time the market alternately bid or offered to a point where there is size to lean on, at which point it gets taken the other way until size is found to lean on. This process is repeated until the size at the "outside" bid or offer (using that term loosely) disappears or size appears to drive the price beyond the range of the opening auction. Sometimes this takes 30 seconds, sometimes it takes a lot longer.

Even amongst short-term traders such as ourselves, there are are a wide range of time-frames traded and a different opening range may be valid for each type of trader. If you are just outside the ring in Chicago on a terminal, with their commission levels and speed of order placement on a terminal then it's perfectly feasible to use the first 1 minute as your opening range. Because of the latency in our quote and order placement set-ups we have to be a bit more laid back about it.

Yesterday, for example, practically speaking, for traders such as ourselves, the opening range was 1096-1098. You could view it as being 11 minutes in duration or 30 minutes, when it was broken. Wednesday, I consider 1090.5-1095.5 to be the opening range and it took 19 minutes to complete. Although there is a case for suggesting that 1090.25-1094 with a duration of 12 minutes was the opening range. I prefer the 90.5-95.5 simply because it's more symmetrical bearing in mind where it opened.

Also, regardless of what you consider to be the opening range, I find using the first hours range as a reference point has merits as well.

Case in point, re opening range. Today: 1104.25-1106.5, duration 14 minutes.....
 
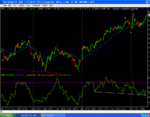
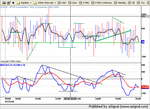
Nice example of rsi support
 

Attachments

  • untitled.gif
    untitled.gif
    56.3 KB · Views: 305
Why I like non trend days

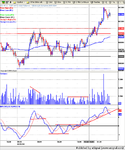
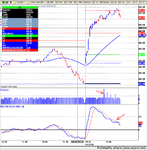
The indicators work on non trend days. Where as yesterday, for all the LH's in the MACD, the internals strength kepted pushing the market higher. On saying that, The MACD did show good support.
 

Attachments

  • dow 5min327.png
    dow 5min327.png
    75.1 KB · Views: 307
THanks for highlighted xbd China, it definetely seems to be leading everything today. ndx/sox are weak though - a bit of a concern that is
 
China

Are you down the beach still. Another quicky. How about the Biotechs as a beta. Thats $BTK.

Is there anyway, I can check these myself or do you need Bloomberg.
 
1 minute ES

Hi

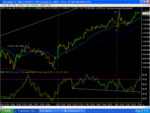
Ranging market and ES MACD 5 35 10 worked a treat. I am thinking of using some of ChartMans Tick Tacks and apply them to this set up. As I have never used ChartMans methods. Does anyone out there fancy helping refine this strategy.

Sandpiper

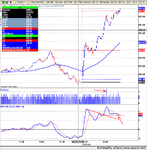
You are right about some people being more adapt to different market conditions. The 1 minute ES/MACD in conjunction with 5 min Tick and ES really suited todays ranging market. Also, the use of horizontal resistance with this method really helps out when assessing risk to reward.
 

Attachments

  • dow 5min329.png
    dow 5min329.png
    115.4 KB · Views: 288
Stoploss

- ideally to trade those intraday deviations btwn 2 stocks u mentioned u want "hourly beta" - i don't even know if it is computed anywhere. Using daily betas for intraday "deviations" is a valid heads-up for entering a notional-neutral spread trade - BUT U MUST undestand the limitations of using daily betas for INTRADAY trading

- well there must be a way to track betas somewhere on Internet - doubt tho u'll beat Bloomies :)

- will check BTK. however from my previous experience (I traded Amgen, Biogen and IMHC on my pro books in 2001-02) they've got too much of a life of their own :) and even tho u get average numbers for Beta they r useless as intraday indicators. A clear manifestation of such a nature wud be massively different Monthly and Daily betas. Will check. XBD is very "stable" in this respect with Monthly Beta at 1.43 and Daily Beta at 1.43.

good w/e to all :)
 
This is spooky. I was born in 1966. I became a T2W member on the 06/06 and I my last post was 666. The market has got to tank on Monday.
 
1 minute $SOX

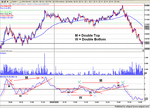
Volume spike in the Semi's just before, the ES continued its move up.

SOX momentum showing a negative divergence. Looking for the SOX to consolidate before I touch the ES
 

Attachments

  • dow 5min331.png
    dow 5min331.png
    82.7 KB · Views: 338
Broker Dealers

The top in the ES corresponds to volume spike in the XDB.

The LH in MACD $XBD was cancelled as soon as the $SOX pushed up. MACD $XBD showing support.
 

Attachments

  • dow 5min332.png
    dow 5min332.png
    80.7 KB · Views: 362
Andy,

As long as you realise it's just tick volume. It may, as you suggest, be significant that you get 6 or 7 ticks in a minute (instead of e-signals norm on sox/xbd of 4), but it's a bit of a shaky one... odd tick volume spikes can have as much to do with latency and clock sync issues as anything.... ;).

This is just horrible two sided trade between 20 and 22 on es. Don't know what to make of it really and have no idea whats significant about the area between 20 and 22 so will be leaving it alone until the dust clears or 2:30 this afternoon, whichever comes first........ ;).
 
Sand

Maybe looking to hard. Been reading stuff on volume over the weekend and trying to identify correlations between the ES and it's Betas.

We have triangles forming on the 1 minute XBD and SOX. I am reading it as accumulation. I would use me as a contrary indicator and be ready to short it.
 
Top