The Darksiding of Forex

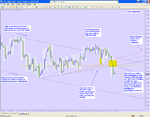
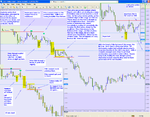
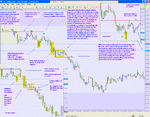
My take on the charts is attached. One 4 hour time frame, because I see the 28th and prior days as key in showing market particpants prior reactions. And one shorter time frames.

This is what I kind of see in my head, although I don't know how "real" this is. Price is decided by an auction process. Buyers want to get the lowest price possible, and sellers the highest price. A straight up straight down movement happens because a buyer takes up all the available merchandise, and any resting at higher levels until the need for merchandise is satisfied - and then fresh sellers keen to sell, put their merchandise on sale at lower levels, competing amongst themselves to get merchandise away. This happens on all time frames depending on the urgency with which particpants want to acquire or dispose of merchandise. On a 15 min chart, this could be seen as a hammer bar, and on a 5 min this process would be a straight up, and then a straight down bar in quick succession. Particpants also have different "needs" for the merchandise. If you are a US merchant bank, buying a UK company for pounds to a set timetable, you have got to have Sterling by a certain time point. If you are a US hedge fund, and all your mates are getting out of the carry trade because collectively, your community is getting spooked by interest rate rises in Japan, (and because everything you spent those yen on is losing value quicker than you even thought possible), then you want to buy yen to settle your obligations before everybody else does. If you are me, you don't need to work to a timetable at all... :LOL:
What interests me here is that although I think in terms of "price" and price levels, I have not managed to "perceive" things in terms of "weak" and "strong" hands, although my way of thinking tells me they do exist, and that their interaction is key to how price moves get eventually resolved. Right now, I am in a position where I wait to see the resolution of the interaction, and jump on the flow from there onwards.

On that Friday, I took a look at the dailies and thought USDJPY showed more clear air below, and a potential for cleaner moves, whereas cable had the potential for a lot of futzting around on the multiple trend lines. Which I why I traded USDJPY instead.

On another note, 110% congrats to wasp for starting this thread, and to all other particpants for keeping this on track! For the last couple of weeks I had given up reading this site, it just wasn't worth the grief... but I popped in last night to find this gem. Very well done......
 

Attachments

  • 070303 analysis 02.png
    070303 analysis 02.png
    75.1 KB · Views: 246
  • 070303 analysis.png
    070303 analysis.png
    107.5 KB · Views: 206
mr.marcus said:
i have decided to do the analysis in 2 parts.

the market at any given time is basically in one of only 2 modes.these modes are formed for a variety of motives and combinations of strong and weak hands.these modes are either exchanging or controlling.i will post the chart for the exchange mode of the chart with text to follow.included on the chart is also the relative volume which would have been occuring.
looking forward to your take on it. I always looked at the market in either a ranging or trending mode but can rarely in realtime decipher when the trend(controlling) part ends and the ranging(exchanging) begins and vice versa.
 
rols said:
There are three receptors for colour; green, blue or yellow. So when the eye 'sees' colour, the colour value is first broken down into these three components first, then added back together again giving us the perception of the original value. Our perception of red for example is induced by the receptors for blue and yellow.

Now in the micro-second between the waves coming into the brain, being processed and giving us the colour and image, guess what happens.

We add our own personal interpretation - our own subjective, subconscious slant through the use of perceptual filters.

Next time you see a red candle stick try and catch yourself intuitively before you have had time to 'think'.

Red after all is only a combination in our brain of blue and yellow pigments, the rest is all us.

Red in nature and our world symbolises danger and anger. Red is also a stop light.

Green suggests go, the colour of nature, a more pleasant feeling colour than red.

So why to many of us put ourselves at an immediate disadvantage by using red and green candlesticks whose colours are loaded with associations, some of which run deep into our primitive survival mechanisms?

Try switching the colour of your candles and see how differently things feel.

The above, and I apologise if it's too long, is just scratching the surface of what we don't know is going on inner minds every second of our existence.


Correction: The primary colours when talking about light are RED, GREEN, BLUE because it is an additive mixing process. Our eyes have receptors for these 3 TRUE primary colours.You have spoken about the primary colours of pigments which is a subtractive mixing process. This is all I can contribute to this thread so far.

Trust me, RGB. If you look closely at your TV screen you will only see 3 coloured pixels RED, GREEN and BLUE. If you are really interested, the Tri Chromatic ratio to make 1 Lumen of white light is 1= 0.59G + 0.3R + 0.11B. This is because our eyes are most sensitive to Green and less sensitive to Blue.

When we see colours other than RED, GREEN or BLUE it is because the primary colours are ADDED (MIXED) by our Brain.

ie/ If the RED and BLUE cones are stimulated the brain will add the signals to produce Magenta.
 
new_trader said:
Correction: The primary colours when talking about light are RED, GREEN, BLUE because it is an additive mixing process. Our eyes have receptors for these 3 TRUE primary colours.You have spoken about the primary colours of pigments which is a subtractive mixing process. This is all I can contribute to this thread so far.
.

Thanks for that. I am grateful. Really.
 
wow, all great and interesting stuff guys, much to read and comment on. cheers all.
 
First - perception

First up, an update on all who have contributed with analysis, thanks very much every one.

I think seeing different perspectives is going to make a big difference to taking things further so here they are before moving to the other great content....

wasp
jacinto
priceman
quercus
superfly
mr.marcus
fish
counter_violent
rainman2


text to go with

1) quercus

Quercus said:
............... a chart is a chart and it don't matter a jot what the instrument is or even what the timeframe really!
Firstly we break out of a narrow range and after some minor swings the first blue rectangle shows the initial area of support which becomes resistance. The three ticked candles are to me significant, and stand out from the rest - they gap higher at their opens and then encompass the action of their previous cousins. The first tick shows to me the initial intent of the session, and it's down - the s/r region was not reached and the action of the candle shows the intent. this is followed by the second blue rectangle of support turned resistance, and whilst this was approached, it was not really reached. Intent has momentum.
The second ticked candle is important as it opens above the prev close but immediately reverses this action and finishes as an engulfing bar, thrusting through the area of potential support. This is followed by a nice symmetrical triangle of price action which I was unable to annotate, but also indicated a continuation of movement.
The next area of potential support is similarly breached by the third ticked engulfing candle which is also the widest on the screen and is a clear sign of continued direction. The next area of indecision/battle is the round number .9450, but this gave up relatively easily. Though I suspect as usual it will play a part again soon, although with all the LL and LH printed, there is little to indicate to me that a reversal or even significant "test" is on the way soon.
As a side note - I find this hindsight analysis both useful AND frustrating. I've done LOTS of it over the years but seem to find my ideas remain fairly simple and limited. Perhaps some of it is becoming a "motor skill" but I'm not convinced that the level of education has been anything near to acceptable or useful. In short I guess I'm looking for a translation of a language which has yet to be defined!?
Q

2) Fish

Fish said:
My take on the charts is attached. One 4 hour time frame, because I see the 28th and prior days as key in showing market particpants prior reactions. And one shorter time frames.

This is what I kind of see in my head, although I don't know how "real" this is. Price is decided by an auction process. Buyers want to get the lowest price possible, and sellers the highest price. A straight up straight down movement happens because a buyer takes up all the available merchandise, and any resting at higher levels until the need for merchandise is satisfied - and then fresh sellers keen to sell, put their merchandise on sale at lower levels, competing amongst themselves to get merchandise away. This happens on all time frames depending on the urgency with which participants want to acquire or dispose of merchandise. On a 15 min chart, this could be seen as a hammer bar, and on a 5 min this process would be a straight up, and then a straight down bar in quick succession. Participants also have different "needs" for the merchandise. If you are a US merchant bank, buying a UK company for pounds to a set timetable, you have got to have Sterling by a certain time point. If you are a US hedge fund, and all your mates are getting out of the carry trade because collectively, your community is getting spooked by interest rate rises in Japan, (and because everything you spent those yen on is losing value quicker than you even thought possible), then you want to buy yen to settle your obligations before everybody else does....
 

Attachments

  • wasp.gif
    wasp.gif
    42.6 KB · Views: 179
  • jacinto.gif
    jacinto.gif
    20.4 KB · Views: 168
  • priceman.gif
    priceman.gif
    71.2 KB · Views: 172
  • quercus.gif
    quercus.gif
    60.9 KB · Views: 182
  • superfly.GIF
    superfly.GIF
    29.8 KB · Views: 185
  • rainman2.gif
    rainman2.gif
    107.6 KB · Views: 164
  • counter_violent.gif
    counter_violent.gif
    14.7 KB · Views: 156
  • fish.gif
    fish.gif
    200.6 KB · Views: 180
  • mr.marcus.gif
    mr.marcus.gif
    65.8 KB · Views: 193
Last edited:
linesniffer said:
Question Time!

1) Would you like to be able to Darkside?

2) Should darksiding be a 'must have' skill of any trader?

3) If you could, would ya?


This deserves its own answer as it is directly linked to the thread title.

I must admit, when I first entitled this 'darksiding', my perception of such an act was to use candle by candle and nothing more or less, irrespective of past, present and future, just the here and now. I stand corrected (cheers linesniffer) and it is actually just streaming price alone.

I know from my perception of the chart posted, i could have and often do, traded straight from streaming prices with a pen and piece of paper. Every entry and level of importance was based, right down to the exit, on each level ( 565, 540, 530, 500, 480, 430) changing from support to resistance. No chart is required for such simplistic views.

The issue i have with using just price in these ways is, are the markets still as simplistic as they once were? Can you really view them the same way as 30/40 years ago when charts were unheard of? As with the new influx of market participants appear, and so does technology improve, are the 'big boys' still keeping it simple enough to use pure darksiding?

So much more attention is paid nowadays to the likes of fibonacci, gann, etc etc that, is darksiding no longer enough and can you read and understand more on intent with a chart over darksiding? In short, is price enough?

For me, the answers are............

1) Yes
2) not these days
3) Yes

So, is darksiding enough for this day and age and market conditions or, is there so much more information loaded into a chart that it makes more business sense to use one? Or, of course (for all the cynics) is all the crap that has been brought with the markets into the next century, over hyped crap and we are seeing more than we need to?
 
colours

I'm sorry to be so simplistic about this and I do appreciate all the comments and thoughts on the subject as it does play different roles in each persons trading obviously, but all I can say on the subject IMO is, green = its going up, red = its going down. It makes it easier for me to see where price is going at any given time from wherever I'm standing at the time.

It might just be me but it has no deep psychological effect for me, its just a physical way of showing the current direction.... I am looking for so many other things in the market that the colours mean only one thing, right this second its moving up or down. sorry!
 
wasp said:
The issue i have with using just price in these ways is, are the markets still as simplistic as they once were? Can you really view them the same way as 30/40 years ago when charts were unheard of? As with the new influx of market participants appear, and so does technology improve, are the 'big boys' still keeping it simple enough to use pure darksiding?
?

Charts was used 30/40 years ago.in fact they was ussing them 100 of years ago they drew them by hand.

Percentage terms the market today is less volatile than from 1930 to 1934 it was nothing for the Dow to have a 20% to 30% monthly ranges, take a look back since 2003 to the present time. you lucky to get a 5% range in one months trading....
 
laptop1 said:
Charts was used 30/40 years ago.in fact they was ussing them 100 of years ago they drew them by hand.

Percentage terms the market today is less volatile than from 1930 to 1934 it was nothing for the Dow to have a 20% to 30% monthly ranges, take a look back since 2003 to the present time. you lucky to get a 5% range in one months trading....

Which is a similar comparison with cable vs say, usdzar. The volatility difference is huge but, at the same time, the basic premise of viewing the market and making tradeable decisions stays the same.

The lack of movement in comparison is regrettable but unavoidable, adapt and die and all that. Thus, in essence, nothing has changed all that much, so, price reading should return equal results to chart reading, and understanding the intent should be just the same either way?
 
So, true darksiding to one side for the moment, (and the virtues or not as the case may be, of colour), any feedback on the current varying perceptions of the 9 different takes on the exact same 6 hours or so of market?

One thing that stands out to me to start, is the support changing to resistance at the 'open' circa 565 and its relevance also, the same around 535. Everyone has noted this.............
 
wasp said:
So, true darksiding to one side for the moment, (and the virtues or not as the case may be, of colour), any feedback on the current varying perceptions of the 9 different takes on the exact same 6 hours or so of market?

One thing that stands out to me to start, is the support changing to resistance at the 'open' circa 565 and its relevance also, the same around 535. Everyone has noted this.............


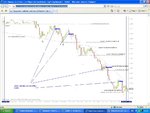
I don't trade Forex, I trade the E-mini S&P500 but the chart philosophy is the same. I will comment on Counter Violents image because it shows Volume. I am fairly new to this so my analysis is basic . With each BLUE triangle drawn there is a clear increase in volume with each lower trough, this indicates a healthy Down trend and that sellers are in control. Around 13:50 the lowest trough also has lower volume which indicates the trend is weakening. 15:10 -20:30 could be an indication that Accumulation is now taking place and there may be a move upwards. But the low Volume could also indicate a lack of interest from both Buyers and Sellers.
 
wasp said:
I'm sorry to be so simplistic about this and I do appreciate all the comments and thoughts on the subject as it does play different roles in each persons trading obviously, but all I can say on the subject IMO is, green = its going up, red = its going down. It makes it easier for me to see where price is going at any given time from wherever I'm standing at the time.

It might just be me but it has no deep psychological effect for me, its just a physical way of showing the current direction.... I am looking for so many other things in the market that the colours mean only one thing, right this second its moving up or down. sorry!

OK, maybe my own perspectives are skewed but few of you have acknowledged that the colour thing was just a very simplistic example of a subject that questions our very essence.

I know you all want talk about charts and price action and why do I insist talking about existentialism and metaphysics?

Ironically, Mr. Marcus seems to be the only one who sees the value of this approach. In fact my friend JJ emailed me earlier and said facetiously he was thinking of setting up cafe for traders called The Holy Grill. A take-away- fast-food-one-size-fits-all solution.

I actually believe that the more knowledge we have about human sensory perception the quicker we will develop as human beings, and and as a salutary benefit, our trading will develop. When we cease to see trading as some advanced computer game and instead perhaps as a holistic metaphor for self knowledge then these boards will become redundant.
 
Hi all,
Thanks for posting the mail from JJ, rols - it was very interesting.
The colour thing is also very interesting and I believe I have been influenced by colour before now, which is why I use white and black candles. The grey background is meant to be soothing and calming with less stress on the ageing eyes. :LOL:
I am seriously considering returning to simple bars with OHLC, and a single dark grey colouring. I've been looking at both for a while now, and as I seem to still like the candles I'll live with them for a while longer.
When I first started to look at simply price and volume (which I hasten to add was my naive understanding of the term "darksiding"), I had some great help from a veteran of these boards by the name of skimbleshanks. Sadly she is long gone and much to the detriment of the site, although not the "business" of the site I suspect! Simple bars have a great ability to quickly allow reference to be made from the close back to the open, perhaps it's because the body is now less domineering although still very apparent.
Just my two cents worth - great effort all round, especially from wasp who inspires me with his commitment, passion, and sleepless addiction to fx! (I'm in the same timezone so I know all too well what it's like) :eek:
Cheers
Q
PS thanks for the input too marcus!
 
yet it can be so straightforward..........
 

Attachments

  • 1.gif
    1.gif
    30.6 KB · Views: 199
  • 2.gif
    2.gif
    32.3 KB · Views: 219
rols said:
OK, maybe my own perspectives are skewed but few of you have acknowledged that the colour thing was just a very simplistic example of a subject that questions our very essence.

I know you all want talk about charts and price action and why do I insist talking about existentialism and metaphysics?

Ironically, Mr. Marcus seems to be the only one who sees the value of this approach. In fact my friend JJ emailed me earlier and said facetiously he was thinking of setting up cafe for traders called The Holy Grill. A take-away- fast-food-one-size-fits-all solution.

I actually believe that the more knowledge we have about human sensory perception the quicker we will develop as human beings, and and as a salutary benefit, our trading will develop. When we cease to see trading as some advanced computer game and instead perhaps as a holistic metaphor for self knowledge then these boards will become redundant.

I really do appreciate your input and find these views fascinating. I realise your talking more than just the colour aspect but I like things simple, straight-forward and facts only. Its just the way I am I guess, always have been with 99% of my life. Theirs a reason for everything and for every move, if it fits, I'm in, if not, I'm out waiting for something that makes sense.

There are a thousand different things that can influence our decision making I'm sure, but to me, I just see action at certain levels with reasons and act on those facts I see.....
 
rols said:
Interestingly enough this is a good example. The pin bar did not break the [email protected]. Also look back to 21 feb.

Short entry @ 1.9558 Stop 1.9575

If the price can now close below 9541 (previous close to Pin bar) then I feel this trade has a chance of success.

1st target 1.9525 second 1.9500 third 1.9490

Just my 2c.


sorry rols, only now, reading back do I notice I didnt see this post. apologies.

j
 
wasp

I've very little interest in forex, but it's a great thread and the charts are intriguing :D

I know it's about dark siding, but I was also intrigued to see how well my 3+bar swings worked on the chart you've been considering. I've doctored one of the charts (yours I think) to show the four good short entries that triggered - some associated with pinbars.

Get behind me, satan, I've enough to do without forex :devilish:

good trading

jon
 

Attachments

  • forex.JPG
    forex.JPG
    98.9 KB · Views: 238
mr.marcus said:
..i would like to give you a couple of questions to think about......what exactly is indecision....indecision with who.....weak hands...strong hands...sometimes we use terms and dont consider what we actually mean...have a think about this simple term which is freely but incorrectly used.if youd like to mail me on it feel free....after the recent exploits im worried not to upset anyone by asking questions back.although they are poignant of course and leading you to very valuable answers..

Right, I will have a go at this one. Indecision question:

the word indecision in trading is the equivalent of using the expression "that is interesting" when having a conversation with somebody. It typically means "I dont know what to say, yet I am listening", or "Ok, move on, not interested", or "Right, cool, I got no clue what you are talking about" etc.

I guess the word "indecision" in trading texts then is an expression used to say....."I got no clue. It looks like price opens, moves up, then down, then closes more less at the same level than it opened". In other words, a Doji or a spinning top.

So, in that logic, because there is a spinning top or doji, then there can only be indecision because there is no direction (at least with that candle). Well, then that is the wrong answer and the wrong interpretation of indecision.

Well, now I think it is relative to the context of where such a formation happens. And still, even if I know where it happens, it is still a word used to say........"i dont know!" and this is simply because it is relative.

I think the answer is actually in one of your questions: indecision relative to who? Indecision relative to which price level, or to which move, or to which player, etc.etc.

My answer will have to be:

Indecision is a wrong term to use, it is a term that causes confusion, it is a term that misinforms. I think I learned a lesson regarding text book expressions. I thank you for that.

Indecision, as wrong a term as it is, ironically, happens at decision levels, where both sides (buyers and sellers) have no clue what is going to happen. REading indecision is probably the most difficult part to read about price action.
regards,

jacinto
 
mr.marcus said:
....beautiful mate....this is the best post ive read for many many moons on this board....outside of the box.....no textbook....no ego....no kiddin yourself.....just self honesty which is the very cornerstone of improvement.....and becoming a strong hand.....continue in this vein and you will no longer be part of the crowd.... free thinking like this leads to success in everything we do....trading is just a great mirror of truth to see who and where we are....bulliten boards are not.
a curry evening in west london awaits you sir!!!

cheers mark j

mark,

thank you for your kind comment. the kudos go to you, as your question is the actual pin on the misuse of the term.

and the curry will be my pleasure. lots of chilli on that, please.

jacinto
 
Top