There has long been debate about price data and what kind of data are most appropriate for market analysis and reference. Much of that discussion revolves around traded price vs. indicative price. The former is the actual price at which a transaction is executed, while the latter uses the bid/offer as the basis for price series.
In the stock market, and most exchange-based markets, much of what is presented to the public is the last traded price. When one looks at the stock tables in the paper, or at the quotes presented on many screens, that is what they see. In many cases, this presents a fair representation of the market. The widely known and understood exception is thinly traded markets where the instrument in question (stock, bond, option, etc.) has not actually transacted in quite some time while prices (in the form of the bid/offer) have moved. Options, in particular, are notorious for this sort of thing. Because many of them trade relatively infrequently, the last traded price often has very little bearing on where the market currently is valuing the option.
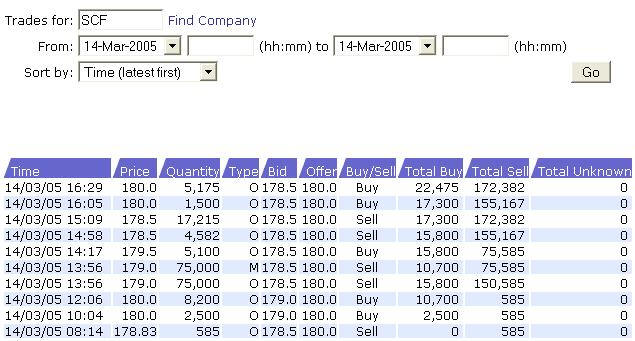
A recent question posed on a discussion board brought up something else traders of lightly active instruments need to consider when looking at prices. The inquirer posted the following screen shot:

The question asked was "How come the market moved up when so much of the volume was on the sell side?" The trader was referring to the fact that the market started the day with a trade at 178.83 and ended at 180.0, but Total Sell volume was nearly 8 times Total Buy volume. It's an interesting question, but had the trader looked closely, he would have observed something important.
Refer to the Bid and Offer columns. Notice that at no point does the Offer vary from 180.0. Notice also that the Bid only changes from 178.5 to 179.0 for two trades before reverting back. This means that while the traded price varies between 178.50 and 180.0, the market actually never moved. All the action which took place did so through sales being made at the bid and purchases getting executed at the offer. It just so happens that the last trade of the day was a buy, which took place at the offer price. That produced a closing price for the day of 180.0, making the market look like it moved from the 178.83 opening price when in fact it didn't go anywhere.
Of course, one can interpret the fact that the massive overbalance in selling volume as compared to buying volume did not move the bid lower as an indication of strength. That, however, is a topic for another discussion. The point here is that when one is trading low activity instruments, one needs to be especially conscious of the real market internals and cannot just count on price to tell the full and true story.
In the stock market, and most exchange-based markets, much of what is presented to the public is the last traded price. When one looks at the stock tables in the paper, or at the quotes presented on many screens, that is what they see. In many cases, this presents a fair representation of the market. The widely known and understood exception is thinly traded markets where the instrument in question (stock, bond, option, etc.) has not actually transacted in quite some time while prices (in the form of the bid/offer) have moved. Options, in particular, are notorious for this sort of thing. Because many of them trade relatively infrequently, the last traded price often has very little bearing on where the market currently is valuing the option.
A recent question posed on a discussion board brought up something else traders of lightly active instruments need to consider when looking at prices. The inquirer posted the following screen shot:

The question asked was "How come the market moved up when so much of the volume was on the sell side?" The trader was referring to the fact that the market started the day with a trade at 178.83 and ended at 180.0, but Total Sell volume was nearly 8 times Total Buy volume. It's an interesting question, but had the trader looked closely, he would have observed something important.
Refer to the Bid and Offer columns. Notice that at no point does the Offer vary from 180.0. Notice also that the Bid only changes from 178.5 to 179.0 for two trades before reverting back. This means that while the traded price varies between 178.50 and 180.0, the market actually never moved. All the action which took place did so through sales being made at the bid and purchases getting executed at the offer. It just so happens that the last trade of the day was a buy, which took place at the offer price. That produced a closing price for the day of 180.0, making the market look like it moved from the 178.83 opening price when in fact it didn't go anywhere.
Of course, one can interpret the fact that the massive overbalance in selling volume as compared to buying volume did not move the bid lower as an indication of strength. That, however, is a topic for another discussion. The point here is that when one is trading low activity instruments, one needs to be especially conscious of the real market internals and cannot just count on price to tell the full and true story.
Last edited by a moderator:
