The Challenge

Ouch!

That just about sums it up.

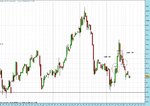
From your chart. Sideways, down, sideways, down...sideways?
Who knows.

What I do know is that you must let the market prove itself to you. Let it show you the way it is going to go. Pin bars. (real ones) will take 2 days from the pin to show that it may be changing direction. Do a google for pin bars and look at some of the examples.
I didn't see your post on the friday before your intended trade or I may have been able to suggest more reason why although you need to trade soon to reach your target, you only want high probability trades.
Next trade, trade the min you can. Really. Trust me on this. If it is a winning position you can add to it at appropriate times. You need to get comfortable with winning.

The chart:
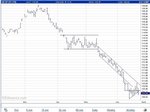
It has made no real attempt to break up from the current downtrend it is now in. Draw the down channel on your chart. Until it breaks the upper line, it is not bouncing.
Volume:
You have it on the chart, so pay more attention to it. Look at the volume 3 days back. Above average yet not much has happened. Actually there is more above average volume for this month then for the rest of your chart. Something is about to happen. Can it go much further downward? Yes, so be careful. But I still think it is going up soon. Remember what I said about 2nd wave. The first push is normally a tester. (You watch it shoot off like a rocket and never get a 2nd push now). :rolleyes:

Lastly take a look at the ibex thread. Currently on the front page :rolleyes: :rolleyes: :rolleyes: You may want to change a few settings
 
I've been looking at your challenge and unfortunately I don't think your chances of success are very likely. I don't mean to **** on your bonfire but £1000 is nowhere near enough to learn about the market and more importantly how your mind will distort things to flatter your own ego. Learning about yourself is the most important element of trading and without doing so you won't have a hope. I've been day trading the bund for the last three years and it's an animal which doesn't often behave as the charts says it should. A word of advice, stay clear of rollover week because trade is choppy and random, and risking a third of your account during the ****test few days of the quarter to trade is not very clever.
 
Chin up mate, you are a quick study. 1k wasn't enough, so 700-odd is still not enough. That's a plus. You were shooting for 10X initial, now are shooting for 15X. If you are good enough to get 10X, then you'll be good enough to get the rest.

I still disagree with this challenge (seems a waste of your time), but maybe the reward is a weekend with a pretty lady :cool: , or something worth fighting for. I hope you're not just doing the challenge out of stubbornness and ego (pride), because as a trader I try to avoid things that block me away from the market action.

As a swing trader, that chart has a beautiful downward trend. Adjust your parameters, follow shorter trends within longer moves, and scramble for small-decent frequent profits. Oh, and if you wouldn't pick your bottom in public, don't do it when trading...;)
 
In his book, Trading Day by Day, Chick Goslin discusses the "laws or trading" where he analyses the odds of trading with a trend vs trying to pick a top or bottom in the sense that a "$1000 profit earned by buying the exact low is not worth a penny more than a $1000 profit earned by buying the middle of an established uptrend, even though the former is much more difficult than the latter." he goes on to say "Since a price with clearly established momentum and trend (ie: a pattern of continuity) is more likely to cntinue its current direction rather than change and if the payoff is the same whether you trade with this higher probability or against it, then obviously the intelligent action is to trade on the expectation of continuation rather than change."
 
Hi Arbitrageur,

Thanks for that quote. It has made me decide to have a serious rethink about what I do, which is, you've guessed it:) , to try to find the bottoms and tops.

Split
 
Its worth reading Chick's book Split, more for his philosophical stuff than his actual system -- perhaps you can get it from a library.

Also worth reading on the subject is the Eckhardt interview in New Market Wizards. Despite the misquoting in the other thread, E really does have some interesting stuff to say in this space.
 
Christ, where did you lot come from? ;)

On a serious note, thanks for the comments, I am reading and absorbing and being patient.
 
Its worth reading Chick's book Split, more for his philosophical stuff than his actual system -- perhaps you can get it from a library.

Also worth reading on the subject is the Eckhardt interview in New Market Wizards. Despite the misquoting in the other thread, E really does have some interesting stuff to say in this space.

Yes, we've got someone coming out from UK next month, I'll get them to bring a copy.

The Eckhardt interview is in the Googlebooks directory. Haven't read it, yet, but intend to.

I tried entering a trade on a trendline, instead of trying to find the bottom, this morning. Damned if it didn't make me a profit first time! Just enough to get me interested:)

Split
 
I'm still wary drawing TL's, options ;)

I see a minor s/r pivot just below 110.40. A break above here would also bring it back into the descending channel.

I'm also noting the very beginning of a rising TL.

I'll wait and see what price action shows me and bear in mind that these levels I have drawn are approximate and that breakout trades should be entered carefully, if at all.
 

Attachments

  • bund.JPG
    bund.JPG
    73.6 KB · Views: 164
No m8. Near perfect lines.

The last 5 days open close have been quite tight to each other, showing consolidation taking place. Okay for intraday trading but terrible for eod plans. So bad for you there.
But price has to break above that lower slanting downtrend line and hold it, and to stay above that horizontal line you have drawing at around the 110.40 mark, for any substantial up move.

After a fairly long extended run down, I don't think it will bounce straight back up again. I think the 2nd or even 3rd wave will come into play. Meaning they will run stops when everyone thinks it is safe to get long again.

To be certain of the up move it has to take out the higher channel line from around mid may.
 
I've drawn two trend lines on the hourly chart. They show a symmetrical triangle from 12 June 2007 (resistance) and from 13 June 2007 (support). The lines are due to intersect around midday (+/- 1 hr) 22 June 2007!

The 15 min chart looks a mess! :LOL:
 
I've drawn two trend lines on the hourly chart. They show a symmetrical triangle from 12 June 2007 (resistance) and from 13 June 2007 (support). The lines are due to intersect around midday (+/- 1 hr) 22 June 2007!

The 15 min chart looks a mess! :LOL:

Fibonelli,

This is an interesting information and I will look closer when I can see a better chart tonight.

In relation to what you say however, I did read somewhere (and you must forgive me, I cannot remember where) that unless a break out happens before price reaches the final third of the symmetrical triangle, the chances of it being false are greatly increased.

15m always seem chaos to me - perhaps because I am inexperienced. I really do like 30m - everytime I see a chart I get a feeling I could trade that if I wasn't at work. The price action at key support/res levels intraday seems obvious and is often rewarding.

This is probably hindsight - it just can't be that easy. Plus, trading with a target of 5 pips (which is what I originally considered) is unlikely to work over time, when the risk on many of these setups is often three times that.
 
A temp has started work at my company and I was moved desk and given a new computer because he needed to use mine to work.

Well, I made it well known I was unhappy about this since I was told only the "old, rubbish" laptops were left but to no avail - I was moved.

Sitting down a while later, I was pleasantly surprised to find that my computer runs quickly and what's more, I can login to E*Trade - and now trade intraday!

Anyone want to take a bet on how long it's going to take me to lose £690?
 
I watched the first setup (of two) develop today. (see chart)

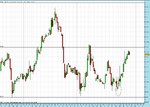
The two bar high occured right in the middle of the support/resistance levels I had drawn on at the beginning of the day and I could see a breakout trade targetting the overhead resistance at around 110.40 before coming off.

Infact this happened almost exactly as I predicted - price broke out and did indeed turn just past that resistance.

But I did nothing - for some reason I just didn't have the confidence to take the trade.

I think I am now worrying over my exit strategy. The risk on these trades (the number of ticks from entry + spread to exit) is almost three times what I planned on taking as profit - 5 ticks. In the second trade the risk is almost four times that! Over the long run, this exit strategy cannot work.

A better strategy on these positions would have been to exit at the low/high + 1 tick of the previous bar. I am going to take a look at the other setups I have posted to see if this is viable.
 

Attachments

  • bund.jpg
    bund.jpg
    166.2 KB · Views: 192
Last edited:
A quick check to see where we are on the daily.

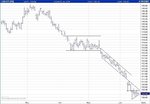
Price failed at the upper descending channel line - it amazes me how the price reacts to the lines I am drawing several days before...

The action looks like its in what I am going to call a chop zone but I have got a bearish bias here with the close below the rising TL.

I see this making a new contract low tomorrow.
 

Attachments

  • bund.jpg
    bund.jpg
    78.5 KB · Views: 153
Don't give up just yet = we've all been along the rollcoaster...

Thanks Hoggums, I think I just let that missed opportunity today get to me.

I'm going to keep a close eye tomorrow and this time if I see a setup, I will pull the trigger.
 
I left the office early today and missed this, although I saw it developing.

Not the best looking pin bar but it came off strong support.
 

Attachments

  • bund.jpg
    bund.jpg
    167.5 KB · Views: 162
Top