The Challenge

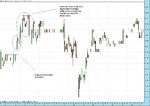
So, we're pushing into new lows in the Bund and the Bobl.

This price action (circled) is actually a trend continuation pattern that I have seen referred to as a double bar high, lower close.

It is where the highs of the two bars are exactly equal but the current bar has closed lower than the lowest point in the previous bar.

This suggests that price may move lower.
 

Attachments

  • bund1.JPG
    bund1.JPG
    57.7 KB · Views: 219
Last edited:
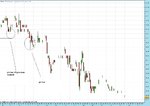
Price moved lower today as the continuation pattern suggested.

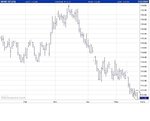
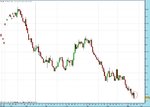
I've attached the daily chart from E*Trade. It has more data and allows me to see how far the market has actually fallen since November.

I have been using bar charts recently but I'm currently studying price action and I find it easier to spot the setups using candlesticks.
 

Attachments

  • dailycandles.jpg
    dailycandles.jpg
    145 KB · Views: 228
Last edited:
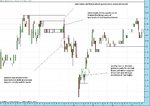
I've looked closer at the two shorter timeframes that Paul Rotter mentioned he used to trade.

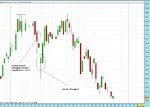
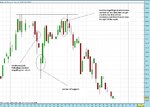
I've noted the price action setups that stand out for me on the 30m chart.

Almost all (I have noted what appear to be losers) setups moved significantly enough to have profited although identifying these is one thing and defining an exit strategy is another and requires some thinking about.

++++++++++++++++++++
Edit: 28 May

I've calculated the profits and losses resulting from these setups over the five days on the chart.

The strategy used to calculate profit/loss has been:

i) Enter market one tick above/below PA setup. Place stop one tick above/below the entry bar.

ii) Exit on whichever comes first - 5 points profit (not including the 3 point spread) or stop hit

iii) If another setup occurs in the same direction but the 5 points has not yet been booked, then it is ignored (but will, of course, provide welcome confirmation)

iv) If another setup occurs in the opposite direction (whilst I am in the market) then I will offset current trade at the same price as entering new one.

The results are:

Day 1

+5
+5
+5

Total: +15

Day 2

+5
+5
+5
+5

Total: +20

Day 3

+0 (Breakeven)
-10
+5

Total: -5

Day 4

+5
+5

Total: +10

Day 5

+5

Total: +5


Total profit after 5 trading days: 45 ticks
++++++++++++++++++++
 

Attachments

  • bund30.jpg
    bund30.jpg
    141.9 KB · Views: 257
Last edited:
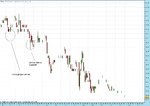
Here are the setups I found on the 5m chart.


++++++++++++++++++++
Edit: 28 May

I've calculated the profits and losses resulting from these setups over the trading session on the chart.

The strategy used to calculate profit/loss has been:

i) Enter market one tick above/below PA setup. Place stop one tick above/below the entry bar.

ii) Exit on whichever comes first - 5 points profit (not including the 3 point spread) or stop hit

iii) If another setup occurs in the same direction but the 5 points has not yet been booked, then it is ignored (but will, of course, provide welcome confirmation)

iv) If another setup occurs in the opposite direction (whilst I am in the market) then it is also ignored

The results are:

Day 1

+5
+5
+5
-10
+5


Total profit at end of day: 10 ticks
++++++++++++++++++++
 

Attachments

  • bund5.jpg
    bund5.jpg
    89 KB · Views: 225
Last edited:
Well, the first month of my year target is nearly at an end.

I've been focussing most of my attention on the Bund. The two markets seem to move almost in tandem at any rate.

I'm going to stay with the Bund, at least for now but keep a close eye on the Bobl.

For the Bund I will continue looking at the two intraday timeframes and the daily, looking for tradable price action setups and trying to work out an exit strategy should I take them.

On the daily, I would look to do this at levels where the price action hints at a reversal. On the intraday timeframes this is harder as the market is much more choppy and I think a specific target - a number of ticks - is perhaps the best way forward.

I'd like to take a look at the CCI and see if it can enhance my setups at all. I will probably start by looking at it on the daily timeframe as the signals are far less frequent. I'm also keen to use some moving averages although it seems that there are a lot of combinations out there and I don't want to fill my charts with indicators that are probably only going to confuse me.

I'd also like to build up a clearer picture of the fundamentals affecting the market. This is an area that I have so far largely ignored in favour of the technicals.

I understand that the market will likely be at the whims of each major piece of news that is released as the traders use them to base their expectations on the course of future interest rates. However, I would like to have a more concrete understanding of the current situation.

Right now I know that the Eurozone economy is strong and that interest rates look likely to be on the up. This in turn means the Bund and the Bobl are likely to continue downwards.
 
Last edited:
I can't check the charts in E*Trade whilst at work but I noticed something on the free charts I've been using over at www.adblue.de

The Bund appears to gap very frequently.

A quick count revealed that over the last fifty sessions, it has gapped by a tick or more but on twenty five of those fifty sessions (exactly half) the gap has been significant.

I can't count the exact number of ticks moved in the gap on these charts but I can see that it is much more. This is certainly a consideration to bear in mind when taking a position that I intend to hold overnight.

When looking at the intraday timeframes I have realised I am going to need to know what the active sessions are. This shouldn't be too hard to find out, infact I can probably tell by looking at the data over a few days. I think this is important because I've heard breakouts of support and resistance are more likely to be fake if it's a quiet session with low volume.

Which brings me to another point. So far I have not looked at volume because it is not provided with the charts I use. I keep thinking that to get on a level playing field with the other traders in this market, I should be watching the "order book" and looking at volume but right now that seems to advanced for me.

Maybe in time.
 
Last edited:
.....The article said he trades between 200-300,000 round turns daily but it also said he only spends five hours at his screens. I worked this out to be one trade every six seconds continually. The speed with which he must be entering and exiting these trades is almost unfathomable to me....

Good luck to you on this. Personally, I'd advise you:
1. Open an account with a US broker...e.g Global Futures, and for your 1000 pounds you'd get more leverage (BUND= 500 US$ IM)
2. Avoid news, it's too risky and like gambling
3. Focus on the 3-5 minute chart, since BUND trends nicely. You can do all that with the very adequate software Strategy Runner, provided by GF. Strictly day-trading, no overnights.

BTW, RT=round trips, means 200k contracts daily. Not that much, well, not as frenetic as you gather. Assuming 1000k a clip (sometimes less, or more, and often strategies of multiple purchases/exits) that's 200 entries, 40 per hour. THere's MUCH more to it than that, though.
 
Just under 11 months to go.

Starting balance: £1,000

No trades in the first month whilst I try and get to grips with this market so the balance remains unchanged but the target is still £10,000.
 
Update on the daily chart.

Market is still moving lower.

A small bounce on Thursday was followed Friday by a bearish engulfing bar which suggests there could still be more downside to come.
 

Attachments

  • bund-daily.jpg
    bund-daily.jpg
    99.6 KB · Views: 181
Last edited:
I'm trying to analyse the charts blind now.

I'll do this by pulling up the 5m and 30m charts which I have not seen before, scrolling back to the beginning of the data and then progressing a bar at a time and deciding whether I would take trades long or short.

I do look at the daily at work so I guess on some subconcious level I could be influenced by the fact that I know it has had a rise or a fall in the day but I am trying to be as unbiased as possible. Infact to highlight this, despite knowing the market closed UP on Thursday, I still opted to take my first blind trade SHORT because I liked the setup.

This is the 30m - traded blind for 10 points profit on Thursday and no trades on Friday.
 

Attachments

  • bund30.jpg
    bund30.jpg
    138.8 KB · Views: 187
This is the above 30m chart with the benefit of hindsight.

Of course, anyone can be profitable doing this. Your eye gets drawn to the large moves and you automatically look for setups near the beginning of them - at least that's the way I find myself doing it.

However, whilst it doesn't have its uses in letting me know whether I will be able to trade this market for profit - it does get me used to looking at the setups that worked and those that didn't.

So, onto the chart...

I wouldn't have done anything differently on Thursday but Friday I would have taken that test of minor resistance short on the close of the bearish engulfing bar for another 5 points profit.
 

Attachments

  • bund30_hindsight.JPG
    bund30_hindsight.JPG
    149.7 KB · Views: 190
Last edited:
Before I go on, let me respond to you Climbing Everest.

Firstly, thank you for reading my thread.

Personally, I'd advise you:
1. Open an account with a US broker...e.g Global Futures, and for your 1000 pounds you'd get more leverage (BUND= 500 US$ IM)

Thank you for this advice I will look into opening an account with a "proper" broker although since I'm based in the UK I would imagine it makes sense to use a UK based broker.

2. Avoid news, it's too risky and like gambling

So far I haven't looked at a chart with regard to news. Something to consider soon.

3. Focus on the 3-5 minute chart, since BUND trends nicely. You can do all that with the very adequate software Strategy Runner, provided by GF. Strictly day-trading, no overnights.

I'm finding so far that the 30m looks a little easier but I'm certainly going to do a lot of work on the different timeframes.

BTW, RT=round trips, means 200k contracts daily. Not that much, well, not as frenetic as you gather. Assuming 1000k a clip (sometimes less, or more, and often strategies of multiple purchases/exits) that's 200 entries, 40 per hour. THere's MUCH more to it than that, though.

Thank you for clarifying this - it makes much more sense!
 
Trading the 5m chart blind resulted in two profitable trades of 5 ticks each on the first day (net gain of 10 ticks) and a net loss of 17 ticks on the second day.

Net result after two days: -7 ticks

Note: On the second chart, you will see that both longs (particularly the first) do rise after entry but because of the spread (3) and the 5 tick target, they become losers.

I am aware that sometimes these trades go much further than 5 ticks but I haven't worked out a way to catch them yet. Something else to consider.
 

Attachments

  • bund5day1_blind.JPG
    bund5day1_blind.JPG
    121 KB · Views: 197
  • bund5day2_blind.JPG
    bund5day2_blind.JPG
    117.3 KB · Views: 182
Last edited:
Trading the same two 5m charts with hindsight.

First day gets an extra 2 trades with a further 10 points to add to the net result on the day.

Second day suggests I wouldn't have entered either of those trades - infact I wouldn't have made any.
 

Attachments

  • bund5day1.jpg
    bund5day1.jpg
    136.5 KB · Views: 185
  • bund5day2.jpg
    bund5day2.jpg
    117.8 KB · Views: 186
I've been thinking a lot about risk management recently.

I've heard that 2-3% risk per trade is the most a trader should take but since this is a challenge and I am not trading for a living, I think my outlook should be much more aggressive.

3% of £1,000 is only £30. Trading off a daily setup and assuming the stop is around 30 points away would mean going on at only £1 a tick. Probably wise whilst learning but also extremely unlikely to produce a tenfold return in just 11 months.

I'm thinking of risking 20% on a strong setup on the daily charts. I'd be looking for a reliable bar setup at an area of confluence such as a strong support.

With 20%, I get five chances before I lose the challenge (and my money.)

However, for day trades I am thinking of cutting the risk right down to just 5% since the market appears a lot more random and I've heard is much harder to trade, on an intraday basis.

Anyone have any thoughts on this?

Also - don't be put off replying to any of my posts just because you don't trade Bunds. You can trade Lean Hogs and Sugar for all I care - I know that you can trade price action across any market out there and I am sure risk management has general rules, too!
 
"I'm thinking of risking 20% on a strong setup on the daily charts. I'd be looking for a reliable bar setup at an area of confluence such as a strong support."


NO!

As you say you would only get 5 chances, And it is very easy to get it wrong 5 times in a row. You have not even experianced a 'real' trade yet so you know nothing of the emotions attached to it and more importantly of how you will react to it. 1,000 pounds is a 1,000 pounds after all.

How long do you intend to hold a position for? a couple of mins/hours, a few days? or until the move runs out of steam?

The correct answer should be until the move runs out of steam. You have seen how the bund trends. How much would you have made had you entered at the top or near the top of the long down move?

The way to do it is to let the market prove itself to you. It will tell you in its' own way where it is going. All you have to do is to enter, (that's the hard part). Be proved right and then to scale into the move at approiate points. It does not have to be the same amount each time.

Had you drawn a upper trend line for this down move and scaled in at every point the upper trend line was touched, with the compounding you are now using you would be on your way to making good your goal.

If you use the 5 min charts you will not know if you are on your a*se or your elbow and the market will have a lovely breakfast courtesy of your account.

You are going up against some of the best traders in the world by using this vehicle.
Do you really think it will be that easy to take their money?
 
I also have the bund as about to attempt a move to the upside.

Will it be a trend line touch and bounce back down again or a reversal?
 
How long do you intend to hold a position for? a couple of mins/hours, a few days? or until the move runs out of steam?

Nothing feels that clear yet but I think that on a trade taken off a daily timeframe, I would look to exit, as you said, when the move appeared to have run out of steam.

On the lower timeframes - 5m and 30m, I would look to just take 5 points each time or see my stop hit.

The way to do it is to let the market prove itself to you. It will tell you in its' own way where it is going. All you have to do is to enter, (that's the hard part). Be proved right and then to scale into the move at approiate points. It does not have to be the same amount each time. Had you drawn a upper trend line for this down move and scaled in at every point the upper trend line was touched, with the compounding you are now using you would be on your way to making good your goal.

I was thinking the same thing. I don't know much about pyramiding. I'm reading almost everything I can get my hands on. I think the best way to do it is to scale in for half as much each time so that the trade doesn't become top heavy. I suppose you could scale in with the same amount each time, too. I think the trick would be to make sure that if all positions are stopped out you are still in net profit overall (and the best way would be to make sure your net profit is higher if stopped, than it was at the last leg).

If you use the 5 min charts you will not know if you are on your a*se or your elbow and the market will have a lovely breakfast courtesy of your account.

By looking at the 5m, I think you could well be right! I feel more confident with the 30m though but at any rate, I'm just observing. Since I will be at work, I will have to just trade off of daily bars.

You are going up against some of the best traders in the world by using this vehicle. Do you really think it will be that easy to take their money?

No I certainly don't. But I can feel the buzz of competition...
 
Last edited:
I also have the bund as about to attempt a move to the upside.

Will it be a trend line touch and bounce back down again or a reversal?

I think the bund looks set to fall further but then again, I've been looking at this for a month. Ha!
 
I think the bund looks set to fall further but then again, I've been looking at this for a month. Ha!


It may very well do so. It just looks in the early stages of a up move. How much I don't know. Until the market proves itself the trend of course is still down. ( I just wouldn't want to open any further shorts at this point, until a move higher is rebutted.)
 
Top