You are using an out of date browser. It may not display this or other websites correctly.
You should upgrade or use an alternative browser.
You should upgrade or use an alternative browser.
The Challenge
- Thread starter bond_trader1
- Start date
- Watchers 14
bond_trader1
Active member
- Messages
- 209
- Likes
- 3
I use a S/R pivot plus Fibonacci.
Interesting...
Ok, best of luck Fibonelli and thank you for continuing to read me!
bond_trader1
Active member
- Messages
- 209
- Likes
- 3
bond_trader1
Active member
- Messages
- 209
- Likes
- 3
I've been active in the Bund over the last few days so I've some updates to make on my progress.
Is anyone even still reading? Hoggums, splitlink, options? Where are you guys?
Is anyone even still reading? Hoggums, splitlink, options? Where are you guys?
bond_trader1
Active member
- Messages
- 209
- Likes
- 3
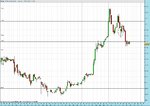
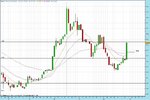
This was not the cleverest trade to have made and the market told me quickly enough.
More and more S/R lines are appearing on my charts as I put in any areas that price has reacted at significantly on the 30m and 1hr timeframes. I am starting to think there are too many.
At any rate, in this trade, I took the break long of a pin bar which bounced on a support area I had indentified.
In hindsight this was probably not the best idea. It's clear from this chart that the market was making a series of lower highs and the sell offs were looking quite sharp.
Still, I took the signal at £3 per tick with a stop one tick beneath the low of the pin - 19 ticks away. This again was not a good idea when you consider that by waiting and being patient you can get setups like my last trade which only risked 9 ticks. Add to that the fact that I closed the last trade for +15 and was willing to risk over and above that on this, I'm really not sure it can be defended.
To be fair, I was 7 ticks in profit at one point and I could have taken it but the size of that stop was making me think I should have hung on for more to get a better return on risk.
As you can see the market then turned abruptly and I lost £57.
This left me with £638 as of yesterday.
Attachments
Last edited:
bond_trader1
Active member
- Messages
- 209
- Likes
- 3
I have been studying a system carefully over the past few days. It looks like it could be very profitable.
The system was originally designed to work on the 5m timeframe on the EUR/USD and GBP/USD but I have looked at it on many markets across different timeframes and it seems to work on them all.
The premise is fairly simple: Add a 50sma, a 21ema and a 10ema to the chart. The original system said to open a position when the angle of the 50 Simple moving average is greater than 20 degrees (this is determined by sight and indicates the intermediate term trend is up) and the price retraces back into the zone of the 21 exponential moving average and the 10 exponential moving average.
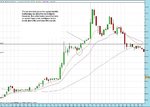
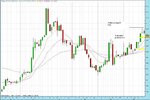
If you look at the 30m chart attached (which is the one in which I lost yesterday) you can see two examples where this worked - presuming you waited for the price to turn back upwards and take out the high of the previous candle. The third time it came into the zone was the price at which I was buying and it then moved higher but it failed.
However, looking at it in terms of this system, I can see that I was buying on the third touch where the 10 and 21 emas look to be losing their momentum and moving sideways.
Now I think this system could probably be enhanced by looking specifically for price action in or soon after a move back away from the retracement zone.
The best trade would have been a combination of certain elements.
Firstly there is a pin bar (circled). Secondly, the low of that pin has hit the 10ema during this consolidation phase. Thirdly the price heads through previous resistance and then finds support there.
An ideal place to go long looks to be on a break of the previous 30m candle with a stop just below that support.
The only problem I see with this setup is that the entry would be taken as the market comes into the close, leaving you vulnerable in the face of an opening gap against you.
Still, it is something to think over.
The original system said to set the stop loss at 6 points plus spread and take profit in the region of 8-10 points. The other directive was to move the stop loss to breakeven as soon as 6 pips gain is obtained.
I may look at the Bund on the 5m chart again with this system in mind although the targets would probably have to be altered due to the difference in the number of points moved on average in the day.
This trade management may be something I can take over to the 30m charts as an alternative to trailing the stop at a previous bar low which I keep coming back to as a potentially good exit strategy.
Attachments
Last edited:
bond_trader1
Active member
- Messages
- 209
- Likes
- 3
I am starting to feel like I have this market figured out.
Which is probably dangerous.
But then again, reading through my earlier posts I do seem to have called it correctly - on the larger timeframes that is.
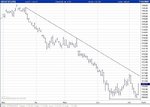
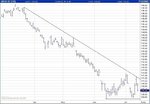
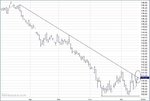
On the charts I use in E*Trade, the previous session close made a pin bar* and since the nose perfectly touched the descending TL, I decided to take this short today.
On this chart below which shows todays action, there is no pin yesterday but the fundamental reason for entering the trade was the same. Price has rejected the upper end of this channel and a test of the double bottom now looks imminent.
Infact, to me this looks like we could be on the verge of a key turning point in this market. If it bounces on that support, the market could finally be showing signs of basing. If it breaks the support, then it could be in for another sharp fall.
Time well tell...
I am short at 110.59 at £3 a tick. My stop is 72 ticks away which represents a risk of £216. At this point almost 34% of my total equity. This is not sensible - I know that! Yet I feel very strongly about this trade and I have decided to take that risk.
* The reason for this is that E*Trade shows gaps up/down in this market by a solid up/down candle. Which means if the market gapped up as it did in this case the market would show a solid green bar upwards at the open which would then retrace as the market fell, leaving a pin at the close.
Attachments
Last edited:
bond_trader1
Active member
- Messages
- 209
- Likes
- 3
http://www.futures-house.com/en/artikel/analysen-Renten-1569885.html
"The Analysts state that the picture is bearish. They expect a direct drop..."
This looks like it doesn't want to go down to me. I've moved my stop to 110.46 which is just above the 50ema on the hourly.
"The Analysts state that the picture is bearish. They expect a direct drop..."
This looks like it doesn't want to go down to me. I've moved my stop to 110.46 which is just above the 50ema on the hourly.
bond_trader1
Active member
- Messages
- 209
- Likes
- 3
Well that just blew right through my stops in a big way!
I was up 48 ticks at one point and now I'm left with just 13 - or £39.
Well, I suppose that is the price you pay for trying to catch the larger move. It's frustrating but I think I was right to try and hold this. I genuinely believed it would fall further today and I trailed a stop directly on the 50ema to stay in through any period of consolidation.
If the trend was down and the double bottom was in for a serious test, then that stop should have been safe.
As it was, the market has taken off to the upside now.
I'm out - with a total balance of £677.
Attachments
Hoggums
Senior member
- Messages
- 2,176
- Likes
- 878
I've been active in the Bund over the last few days so I've some updates to make on my progress.
Is anyone even still reading? Hoggums, splitlink, options? Where are you guys?
I'm still here.
Riverland
Junior member
- Messages
- 13
- Likes
- 1
Yep, i've been reading your journal too. I don't have any interest in trading bonds but your tale is enjoyable all the same. We all learn a valuable lesson by taking a big loss. Keep compounding those less ambitious wins and hopefully you'll be in profit soon. Good luck, I really hope you make it through the year.
Hoggums
Senior member
- Messages
- 2,176
- Likes
- 878
Well that just blew right through my stops in a big way!
I was up 48 ticks at one point and now I'm left with just 13 - or £39.
Well, I suppose that is the price you pay for trying to catch the larger move. It's frustrating but I think I was right to try and hold this. I genuinely believed it would fall further today and I trailed a stop directly on the 50ema to stay in through any period of consolidation.
If the trend was down and the double bottom was in for a serious test, then that stop should have been safe.
As it was, the market has taken off to the upside now.
I'm out - with a total balance of £677.
I don't trade the bund - I found it was far too choppy and the trends do not last long enough, by the time you've identified it - it changes again. However I've just had a look at the chart and it appears there is a triangle wedge forming. Personally I think the overall trend is down - but there's so much volatility in there that there are too many false signals coming through.
I would wait for the price action to break convincingly out of this wedge. My prediction is that it will break out below - but I wouldn't put money on it!!
bond_trader1
Active member
- Messages
- 209
- Likes
- 3
bond_trader1
Active member
- Messages
- 209
- Likes
- 3
Swinging for the fences
Yesterday I had a strong feeling that the Bund had gone as low as it was going to go for the time being and it was now on its way up to test the upper trend line once again.
The price action showed me the market was moving higher but there were still areas just overhead on the hourly charts that had acted as previous resistance and which the price could have stalled at.
Nevertheless, the instinctual feeling that this was going to break higher was strong and there I was with £677 and no position.
So I decided to buy £3 at 110.75 as the market made a new intraday high.
I put my initial stop at 110.32 (43 points away)
Attachments
bond_trader1
Active member
- Messages
- 209
- Likes
- 3
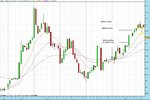
I considered it very positive that the market was moving higher into the close so I decided to buy some more as the price made a new intraday high.
It did this at 110.95, so I added another £3, making me £6 per tick long.
Since this was the highest amount I have traded and my account is undercapitalised for this kind of business, I decided to put the stop on my initial position at breakeven (stops are indicated on my charts as yellow lines)
I placed the stop for the second, higher position, at 110.55 - if memory serves me correctly (I'm afraid I moved stops several times as I deliberated)
This second stop was just beneath the two short term emas (10, 21) I now like to use.
This meant that the total amount at risk was now marginally less at 40 points (instead of 43 when I took the first position) and yet I had doubled my position size.
Attachments
bond_trader1
Active member
- Messages
- 209
- Likes
- 3
The Bund came off on the market open but bounced at the short term ema (10) and moved higher again but right around the descending trend line it ran into trouble.
By the time I had finished my coffee, the price had formed a pin bar at the 10ema once again and looked ready to make another assault on that trend line.
This time, rather than waiting for a new intraday high, I bought another £3 at 111.05 in anticipation of one. This was rather impetuous and not particularly sensible.
So, there I was, with £9 a tick long and the market made a new high and then rolled over just 3 points above it, forming what looked suspiciously like a double top.
At this point, the size was starting to disrupt my concentration at work so I made a decision that I was going to bring my stops up right underneath 111.00 so that unless it took off from this point, I was going to be out of the market.
I had a quick think and moved my stops as followed:
Position 1: Entered at 110.75 - stop placed at 110.95 (+20)
Position 2: Entered at 110.95 - stop placed at 110.95 (break even)
Position 3: Entered at 111.05 - stop placed at 110.86 (-19)
I made a lot of calculations, working out the different outcomes from different exits but ultimately I decided to swing for the fence on this trade.
Just after I put my third position on, I was up £147 and yet once I had placed my stops, it meant that if the price hit them all, I would make just £3 profit.
Then again, I had trebled my original size and gone from a risk of 40 ticks to a worst case scenario gain of 1.
Attachments
Last edited:
bond_trader1
Active member
- Messages
- 209
- Likes
- 3
As it turned out, I made a mistake in which orders applied to which price. The first I knew of this was when my third position at 111.05 (originally with stop at 110.86) was stopped out at 110.95, causing me a loss of £30.
You will remember, I had two orders at this 110.95 level but by the time TD Waterhouse came to fill the second one, the price had bounced slightly so they didn't fill it and instead left the position open.
Well I was rather put out that I had lost £30, particularly since the price started moving above the 111.00 level again.
So I was watching the price action closely and I got a feeling that the market was very reluctant to go higher, so I decided right then to get the stop up on my first position (which I thought was at 110.95 but was really at 110.86) up to 110.95 so that both my remaining positions would go at that level.
However, for some reason, I got an error message when I tried to move it. The account said "not enough funds to move the stop" even though I was moving it to a level which would lock in more profit.
I presume this was a system error but since I wanted to get out at 110.95 now, I watched it for a manual fill.
After some time, the market was very still at a level just above it and needing to get on and do some work, I sold the position manually at 110.99, which made me 24 ticks or £72.
The remaining stop was already at 110.95 (break even) and was triggered shortly after when the market fell sharply.
So I came out with £42 net profit on the trade(s).
Last edited:
bond_trader1
Active member
- Messages
- 209
- Likes
- 3
I entered the market again yesterday - only this time the outcome was disasterous.
I made two fundamental mistakes:
I chased the market.
I took on far too large a position with no regard for risk management
As a result, I took a £198 hit and saw my equity fall from £719 to just £521.
Let me show you what happened...
I made two fundamental mistakes:
I chased the market.
I took on far too large a position with no regard for risk management
As a result, I took a £198 hit and saw my equity fall from £719 to just £521.
Let me show you what happened...
Similar threads
- Replies
- 1
- Views
- 5K
- Replies
- 2
- Views
- 2K

