The Challenge

Since I am losing the data in the June contract, I've made a note of the relevant areas of support and resistance that I see in the market.

Support:

111.62 recent lows - double bar

Resistance:

112.60 minor resistance
113.00 minor resistance
113.40 previous channel support
114.20 price pivot zone

It's worth nothing that these areas are approximate.
 
Make sure you read the other post of mine on the other thread you started.

If you spread bet just use IG

Time to get off your A*SE** now guv you only have 11 months.

Start trading!
 
Last edited:
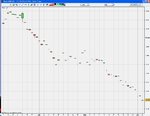
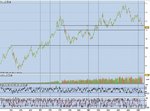
Screenshot of IG's chart of the Bund on a daily timeframe.

I put the question to you: how the *$%! are you supposed to work with that?
 

Attachments

  • bund.jpg
    bund.jpg
    95.8 KB · Views: 177
Last edited:
Lol! That's the chart I got when I said earlier in this thread about it being 'akward'.

Just go out to a daily/hourly etc. It should change the view a bit.
 
Lower timeframes are fine but the daily is seriously corrupted!

At any rate, I'm now set up with ProRealTime.

Options, thank you very much for that link.

Over fourteen years of data on the Bund! Honestly, I haven't been this excited in a long time.

What's happening to me?
 
If this data is to be relied upon, then today was a record volume for the Bund since as far back as 1993 (and likely since contract inception considering the low volume back then)

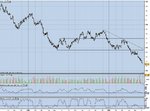
Someting interesting also occured to me on studying this chart. I drew in the pivot point zones where support has become resistance and vice versa and I noticed that as I zoomed further out, the price still reacted at these levels.
 

Attachments

  • bund1.jpg
    bund1.jpg
    174.8 KB · Views: 180
In this chart we can see the bigger picture - 2004 onwards and both pivot points still hold up.
 

Attachments

  • bund2a.jpg
    bund2a.jpg
    183.2 KB · Views: 162
There are many of these areas on the charts but rather than draw them all in, I am concentrating on the ones that are closest to the price.

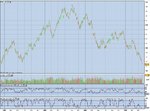
This chart (2001onwards) show a pivot point zone that hasn't been tested since the recent break.

If price was to correct, this is where I would watch carefully.
 

Attachments

  • bund3.jpg
    bund3.jpg
    190.5 KB · Views: 148
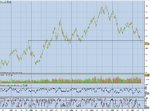
This chart shows all the data I have (1993 onwards)

Coming into 100 there is another zone of previous resistance turned support.

This area has been inactive since 1997. Although it did comes close in 2000.
 

Attachments

  • bund4.jpg
    bund4.jpg
    184.3 KB · Views: 169
Hi BT

Nice thread!

I don't know what timeframe your trading, but I've noticed that today's upmove (weak stockmarket may have helped?) has surpassed the multiple 15 min and 1 hour trend line resistance that I drew after last night's close.

The daily trend line resistance is currently around 11233.

Fibonelli
 
If this data is to be relied upon, then today was a record volume for the Bund since as far back as 1993 (and likely since contract inception considering the low volume back then)

Its rollover tomorrow so you're seeing the roll volume, hence the huge numbers.
 
Its rollover tomorrow so you're seeing the roll volume, hence the huge numbers.

Minx,

This is the Bund Future (not month specific) so if what you say is true, then wouldn't there be a similar spike in volume just before every rollover?
 
A trader on another thread mentioned professionals using Market Profile to trade the Bund.

The one thing I have realised after reading about traders is that there is no "right way" to make money in this market or any other.

A vast number of different strategies can have the samel level of success as long as an edge exists in them to begin with.

Common strategies do not unite winning traders - attitudes do.

Strategies can be learnt. So can risk management. Both can be, although do not need to be, as simple as a set of rules. But psychology plays a part too. The enemy, they say, is within. And I think conquering him will be the hardest part of this game.

So, I think it is best for me to work with what I have for now otherwise I am in danger of starting down too many evenues without properly exploring any of them.

As I have been told and know myself, it is time to start trading. Experience is key and time is wasting...
 
Last edited:
Minx,

This is the Bund Future (not month specific) so if what you say is true, then wouldn't there be a similar spike in volume just before every rollover?

The future has to have an expiry date so they are month specific. And yes, there is a vol spike every rollover. June rolls today and Sep is now the new front month.
 
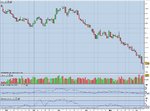
I've been waiting for this price action and today it happened.

A pin bar at a swing low is a very reliable setup that suggests a move higher may be about to happen.

I am going to place an order to go long the September future at 110.99 which is one tick above the session high.

My stop will be at 110.25 which is a tick below the session low.

The risk is 74 points.

I am considering taking this at £5 a tick which would be a risk of £370 or 37% of my account.

I am fully aware this is a large percentage of my total equity to risk but then again, trading off a daily timeframe doesn't generate many signals and I have just under eleven months left.

If I was trying to make a living trading then preservation of capital and risk management would be of utmost importance but I'm not - I am simply trying to hit a target to win a challenge. And I think that needs to be considered when I think about my risk.

Still, anyone reading this has the weekend to talk me out of it.
 

Attachments

  • bund1.jpg
    bund1.jpg
    166.3 KB · Views: 178
OK, I'm long at 110.99 at £5 a tick.

Stop is at 110.25

Target: Open.

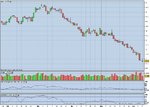
After opening lower, the Bund moved up and broke the previous session high, filling my order. It has since come off and is now trading back below 111.
 
I'm £120 down on this position as of the close and I'm wondering whether I should have put an entry more just than one tick above the previous session high since the market only made it as far as four ticks above it before reversing.

Looking at the chart, it doesn't seem so bad - my stop is certainly not in any immediate danger.

Which brings me to the stop itself. I don't feel particularly confident after the session but I am confident about the placement of my stop: if it is hit, then I am wrong .

I told a far more experienced fellow trader about my position and after a look at the chart he told me that he would put his stop at 110.70 which he said (and I could see) was an intraday pivot point zone (support/resistance pivot not the calculated pivots)

And yet, this doesn't make sense to me. I took the position based on a daily candle and the price action setup it represented, so I think I should use that same timeframe to define my exit otherwise I could run the risk of getting shaken out of the market.

I have bet on a market turn and a move down to a new contract low is the opposite outcome.

I suppose that having a stop just one tick below the previous session low poses the same problem as the entry - it could be hit and then price could reverse but in my opinion, if I am right on this then the price should not make a new low. At all.

If it does, then I do not want to be in it anymore. Simple.
 

Attachments

  • bund1.jpg
    bund1.jpg
    152.5 KB · Views: 153
I checked my account just now and found that E*Trade closed this position for me at 110.37 (12 points above my stop order).

Unfortunately, customer services is closed this evening so I have no idea why they have done this. There was certainly more than enough funds in the account to hold the position to my stop. I will ring tomorrow.

At any rate, I can now see the market is moving still lower and is just 6 ticks above my original stop level.

This is frustrating but at the same time offers me some relief. The relentless push downwards in the Bund has caused me to feel irritable and depressed and if it had closed just above my stop then I could have added worry to those emotions, on the possibility of a gap down on tomorrows open.

As is it, I am out. £310 worse off, however.
 
I never did find out why E*Trade stopped me out early. Since price went on to hit my original stop anyway, I considered myself lucky that they saved me £60.

I've had a few days break because that failed trade taught me an important lesson. Options tried to warn me in an earlier post but in the end I had to make the mistake and find out for myself just how important risk management is in this game.

It's all well and good waiting for a high probability setup but as Richard Dennis said in Market Wizards:

"On any individual trade it is almost all luck. It is just a matter of statistics. If you take something that has a 53 percent chance of working each time, over the long run there is a 100 percent chance of it working."

Which doesn't help you at all if you leverage your trades in such a way that you can only afford to trade three times before blowing your account out.

Larry Hite summed it up wonderfully in the same book:

"I have two basic rules about winning in trading as well as in life: (1) If you don't bet, you can't win. (2) If you lose all your chips, you can't bet."

However, as far as I see it, there is a fundamental conflict in my trading approach. I want to be around to play my edge out and let probability work for me but at the same time, I am fully aware that if I don't bet large, I probably won't win.

The dilemma is that making large bets on the Bund with an undercapitalised account could wipe me out but it won't prove that I do not have a tradable edge. At the same time, playing great defence, building my pot and proving that I can trade this market, still constitutes failure, if I don't hit my target.

So, for the last few sessions I've been having these conflicting thoughts and thinking rather than writing.

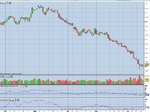
I'll finish off for now but note that the Bund formed another pin bar (after the one that I lost on), which would have triggered a long but since then it has moved lower and would still not be in profit now.

Interestingly enough, this pin and the last session's mooe higher has been directly off the pivot point zone that I predicted could come into play several posts back.
 

Attachments

  • bund2.jpg
    bund2.jpg
    153.5 KB · Views: 174
Last edited:
Top