bond_trader1
Active member
- Messages
- 209
- Likes
- 3
10 months to go.
Starting balance: £1,000
Target: £10,000
Current balance: £690
Not looking good...
Starting balance: £1,000
Target: £10,000
Current balance: £690
Not looking good...
The bund gapped up through my stop on the open.
Fortunately only by 2 ticks.
Another loss. This time it was £40.
bond_trader - you seem to be picking trades that go against the longer term trend (from the 2 I've seen) which in my view is a risky strategy. When you make a profit I'm sure they will be large, however you are relying a break of the current trend for that to happen, which in my view will not happen more often than it does.
Just my 2p's worth..
At this point, I have lost three trades in a row and have £650 left of my original £1,000.
Of course losses are to be expected, trading is incredibly hard, this is a difficult product to trade and I am very inexperienced.
But I can't help realising that if I had kept to my original plan and traded price action setups on an end of day basis, I would now be ahead.
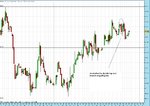
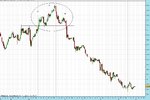
If you look at the two circled pin bars on the chart attached you will see the first one was the one in which I lost 74 ticks.
The second one would now be ahead 81 ticks.
Of course whether this would have meant I would now be in profit would be dependent on many things such as where I would have trailed my stop or whether I would have exited some of my position at resistance levels.
However, it is confirmation that if you have an edge or a strategy, you need to give it time to play out. What I did is take a large loss and start trying to trade intraday which is, I have been told (and am really starting to believe) far, far harder.
Hi BT1
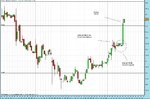
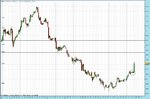
There was breakthrough in the pivot point for the Bund, Bobl and Long Gilt. Good to see you taking advantage. I missed it 'cos I was busy researching a trading strategy.
Hi BT1,
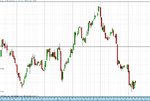
11017 for the Bund. It was the intra day support on 5 July 2007 which became resistance during the afternoon of the same day and the next day. Resistance gave way after 1pm today. Easy to see on a 15 min chart.
Fibonelli