Swingin' the ftse 2010

According to Sharescope chart, today was a near perfect morning star / inverted hammer pattern. This suggests a buy order to catch any rally tomorrow, high enough to obtain confirmation of bullish strength - above today's high? With a stop at the low, the 120pt risk is a bit steep but worth the risk I feel. Thoughts anyone?

I typed a post last night that hasn't appeared for some reason...ho hum.....

Anyway, after an intra-day drop of 1,000 points on the Dow, I'm not sure I want to be long these markets although 'word on the street' is (at least the bit of the street I work on) is that yesterday was aberrational in the US to some fat fingers and an ensuing program triggered sell-off. Nasdaq are canceling trades.....

I don't see the inverted hammer - is it only on Sharescope?

Personally, I'm waiting to see what unfolds.
 
Came within a dozen points of a change of trend sell signal today. Blimey.....

Sell in May and go away.

Anyone think there is anything in this chart malarky? :LOL::cheesy::LOL:
 
Hi Mr. G - FTSE charts can vary where they put the open so patterns like hammers and opening gap patterns can be ambiguous depending on your data provider. Its a pain. And of course SB tick charts give a toally different picture again as they include quotes outside 0800-1630.

We have another putative swing low yesterday but the same old problem - the 'orthodox' stop is way below entry (220pts / 4%) so where do you place a stop on a long if we breach yesterday's high? - an intra-day support level? a percentage loss level? fibonacci?

I am inclined to stay in cash until we've had a clear week of 'normal' volatility.

That said, I was reminded by this week''s plunge of a smart little video by Sandy Jadeja on CantosTV (see YouTube) - when we have an outside weekly bar (see w/e 30/04), set a buy at the week's high and a sell at the week's low - this could this week have captured 488pts: that's against a risk of 268, making less than 2:1 r:r, and 268's a large number anyway, but he says its a very dependable strategy......
 
got a few swing points on my chart
1 min data
6.50 box size by 3 reversal
lots of downtrend lines showing resistance areas nicely

5pne9z.jpg
 
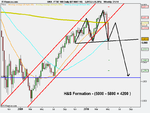
FTSE 100 - Weekly chart ..........Head & Shoulders activated , if FTSE remains below 5500 then bear pattern remains active !! Target 4200
 

Attachments

  • FTSE 100 Daily (07-MAY-10)H&S.png
    FTSE 100 Daily (07-MAY-10)H&S.png
    15.9 KB · Views: 145
4200.
Why not?

With such cack-handed management of the Greece debt crisis, the UK General Election, New York financial markets and of the most fragile of recoveries, 4200 might be conservative.
 
............I was reminded by this week''s plunge of a smart little video by Sandy Jadeja on CantosTV (see YouTube) - when we have an outside weekly bar (see w/e 30/04), set a buy at the week's high and a sell at the week's low - this could this week have captured 488pts: that's against a risk of 268, making less than 2:1 r:r, and 268's a large number anyway, but he says its a very dependable strategy......


A little backtesting suggests Sandy Jadeja is right about this system. A week's high-low range on the FTSE tends to average 7-8% over last few years so this could be uncomfortable for some players. But gains occasionally go over 20% within a few weeks. If you settle for about 5-7% you'll get it most turns. If the week's range / risk is over 10% you could always let it go by or set a more tolerable TA or %-age based stop. So uncomplicated and dependable its worth looking at.
 
Friday could be the swing low we have all (me only?) been waiting for.

Buy order in above Friday's high.

Tom - I like the outside week method you mention above. One of the things I like about this board are the new ideas that are discussed. Keep 'em coming...!!! :clap:
 
Mr G. Did you get in at a reasonable price. Looks like prices gapped up quite a lot. However, you should be in the money now.

I agree with tom. I am sitting on the sidelines to wait and see what unfolds. Too much volatility.
 
Mr G. Did you get in at a reasonable price. Looks like prices gapped up quite a lot. However, you should be in the money now.

I agree with tom. I am sitting on the sidelines to wait and see what unfolds. Too much volatility.

5264 and 5266 - two different prices as I had the high at 2 places (one Prorealtime the other FT) so I split my order. I have trailing stops in - one at 25 pts and the other at 50 pts.
 
Friday could be the swing low we have all (me only?) been waiting for.

Buy order in above Friday's high.

Tom - I like the outside week method you mention above. One of the things I like about this board are the new ideas that are discussed. Keep 'em coming...!!! :clap:


Cheers - I was reading today that if the close of the outside week is higher than the previous week's close this is even more positive and reliable: the converse if the outside week's close is lower than the previous week's close. If the outside week's close exceeded the high or low, that would make it a key reversal if in a trend.
 
Could be ripe for an 80-20 trade tomorrow?


Yes, about the only likely trade, as am ignoring the standard three-day long swing trade while the stop is so far away. Need price trading above 5400, set sell at this level. Daytrade only, exit at / by the close.

Possible whiplash too I suppose: sell at the close if open gaps above 5400 and closes down on the day and below 50% level in today's range.

But these are high-risk times and even a daytrade would be ambitious for me right now.
 
No signal for me but the gamblers here are going to go all in long now that Brown has resigned.
 
Today confirmed some reasonable bearish signals -
* confirmed 13/05 as swing high, much lower than previous swing high 16/04, suggesting trend
changed to down
* confirmed evening star
* confirmed hikkake
All point towards short entry of course.
 
Today confirmed some reasonable bearish signals -
* confirmed 13/05 as swing high, much lower than previous swing high 16/04, suggesting trend
changed to down
* confirmed evening star
* confirmed hikkake
All point towards short entry of course.

Where will you be placing your entry Tom? According to Rivalland rules, we don't have a change of trend yet but as he says, hard to describe these markets as still being in uptrends.
 
I think more and more that management of positions is more key than finding the sweetest entry point. As long as you have a TA rationale for entry and control of risk, any of the above would do.

Most aggressive entry would be 5381 taking the 3-day swing down. Then 5257 (which I have taken) for the hikkake. 5045 may soon be seen and would confirm shift to downtrend according to Rivalland I think and also take out the outside week's low (w/e 07/05: made an outside bar by the last week's inside bar). All have sensible stop positions available, as long as you don't put the house on any one of them.
 
Top