You are using an out of date browser. It may not display this or other websites correctly.
You should upgrade or use an alternative browser.
You should upgrade or use an alternative browser.
I'm finally long on the FTSE as of yesterday. Missed the breach of the 03/03 swing high as entry signal and then got distracted by other indices and gold. Anyway, long as of yesterday using Inside Day 11/03 as signal.
Actually, these aren't great signals on their own. On another thread I posted that I had found only 50-60% of IDs lead to a tradable break-out. On the FTSE in 2009 it was at the higher end of this range, 58%, but still not that impressive. Hikkakes are a much more reliable signal basing on an ID but are not frequent.
Anyway, entry was based on 5643, stop on 5594.
Last edited:
wallstreet1928
Legendary member
- Messages
- 6,609
- Likes
- 89
I just want to say Good thread guys, keep up the good work
Mr Flibble
Well-known member
- Messages
- 371
- Likes
- 20
Hello chaps, I'll be trading the FTSE from now on amongst others. Looking forward to hopefully getting some pointers from the more experienced of you. I was playing channels on Friday with some very quick action but got hit at 1:30pm with a huge upward run. I used City Index and even on the tick chart it went up 15 points within miliseconds. Lesson number one learnt the hard way.
For all its worth I'm currently long on a revenge trade. Sad but I'm just being honest. I aim to change the way I trade especially my whole psychology. My entries are normally really good its just the management of the trade I need help on.
Anyone else here use divergence and Japanese candle patterns to trade the FTSE? Or do I need to modify my system?
Good to see you here Mr Flibble. I was enthused about 2 years back by re-reading Alan Farley's The Master Swing Trader and Connors & Raschke's Street Smarts. |started top monitor the FTSE on a daily basis for patterns they highlighted and to trade them when I could, though swing trades based on Rivalland's three-day reactions took precedent so could not always take a second or third position.
The candlestiock patterns I was looking for were -
ID/NR4
3-Day Unfilled Gap Reversal
Hole in the Wall Gap
Whiplash
Key Reversal
I also occasionally took swing trades based on a two-day reaction.
Last year I became interested in a simple points-scoring system to identify worthwhile trades based on price/14EMA crossover. Most recently I am studying Inside Day break-outs and hikkake. Most of the above-listed would have time horizions inside the three-day reaction swing trades which have been my bread-and-butter and the opportunity to run one or two or three additional trades before the swing position matured was appealing.
I still think these are brilliant brilliant texts for traders. However, like many others before me, I fouond that any one of these patterns alone is unlikely to be highly profitable on a mechanical basis. With one exception they tend to have 50-60% success rates on modest ranges of travel with r:r of 1:1. All positive, like the books say, but its never going to be easy to become a millionaire on a 55% strike rate strategy. Others suggest you need to identify trend and associated s/r levels to determine the trades you should ignore: you could also have an asymmetrical larger position size for the more favourable trades. Maybe so, but these things are hard to objectively back-test, especially on the FTSE, which often has a dual character as an independent index in the am and a derivative of the US markets in the pm.
The main exception to the marginal success rates above is the hikkake, which generally wins 70-80% of the time without any regard to s/r levels, trend or anything else. But its not that common - I found 123 across 13 markets in 2009 charts. Its not only a small sample, but even if it works its not a common signal.
Most recently I read Kathy Lien saying that two consecutive Inside Days is a much more reliable break-out pre-cursor pattern than one alone. sounds rational and I intend to back-test this also.
Meantime long FTSE from 5643 on 12/03 on ID B/O.
wallstreet1928
Legendary member
- Messages
- 6,609
- Likes
- 89
Most recently I read Kathy Lien saying that two consecutive Inside Days is a much more reliable break-out pre-cursor pattern than one alone. sounds rational and I intend to back-test this also.
Meantime long FTSE from 5643 on 12/03 on ID B/O.
What TF was Kathy Lien working with? Because two IBs on one TF becomes one IB on a higher TF. That bears out the belief that the IBs are more reliable, the higher the TF, the same as p-bars.
What TF was Kathy Lien working with? Because two IBs on one TF becomes one IB on a higher TF.
Daily ranges. Consecutive IDs aren't that common across indices but see the DAX on 12 and 15/02. Unfortunately, this pair was followed by an Outside Day, which raises the old problem of going in in the am and getting stoppped out in the pm, only to see price break out the next day. Waiting for a hikkake pattern of course would eliminate the risk of same-day entry and stop.
SuperScalper
Member
- Messages
- 56
- Likes
- 0
Hello chaps, I'll be trading the FTSE from now on amongst others. Looking forward to hopefully getting some pointers from the more experienced of you. I was playing channels on Friday with some very quick action but got hit at 1:30pm with a huge upward run. I used City Index and even on the tick chart it went up 15 points within miliseconds. Lesson number one learnt the hard way.
For all its worth I'm currently long on a revenge trade. Sad but I'm just being honest. I aim to change the way I trade especially my whole psychology. My entries are normally really good its just the management of the trade I need help on.
Anyone else here use divergence and Japanese candle patterns to trade the FTSE? Or do I need to modify my system?
it was the retail sales for US at that time......
better keep an eye on the major economical realises everyday! it might save you few pounds !
Hello chaps, I'll be trading the FTSE from now on amongst others. Looking forward to hopefully getting some pointers from the more experienced of you. I was playing channels on Friday with some very quick action but got hit at 1:30pm with a huge upward run. I used City Index and even on the tick chart it went up 15 points within miliseconds. Lesson number one learnt the hard way.
For all its worth I'm currently long on a revenge trade. Sad but I'm just being honest. I aim to change the way I trade especially my whole psychology. My entries are normally really good its just the management of the trade I need help on.
Anyone else here use divergence and Japanese candle patterns to trade the FTSE? Or do I need to modify my system?
I think I know the one you mean. I got stopped out because I was short. Be careful of the run up to that time because the the Dow starts getting playful then. Before that we have lunchtime chop. That's boring stuff and best avoided.
Last Friday wasn't a very good am trading day, in any case. I think I made about 11 points before lunch and lost 9 on that move that you mention.
These guys are longer term, though. 🙂
Mr Flibble
Well-known member
- Messages
- 371
- Likes
- 20
Wow guys really nice thread. Friday was an excellent example of some of my trades. Won 6 lost 1 and still made an overall loss of 20 points. I like your approach and will have to dip the wing of humility to you guys on an indices that I know little about. The reason I avoided it in the past was it obvious correlation to the US markets, with the US markets being the driving force. However having said that we still seem to get a little period all to ourselves from about 8:00 - 1:00pm ish. I will avoid playing this market after 1:00pm as its just way too volatile for me.
I'll do some quick TA and justify my position long on this first.
I'll do some quick TA and justify my position long on this first.
Last edited:
Mr Flibble
Well-known member
- Messages
- 371
- Likes
- 20
OK I'm going to stick my neck out here and say we're going down. I'm seeing some bearish divergence. We've been hanging around in this range from 5624-5618 and most of the ticks are at the lower side of that. I'm just watching some keys US stocks and the premarket trading action is fairly negative. Any thoughts?
Mr Flibble
Well-known member
- Messages
- 371
- Likes
- 20
Thanks for that. I'm currently on my 6th trade now long for a few points..or so I hope looking for a target of 5619. Perhaps I need to take a step back and play these longer trends.
Mr Flibble
Well-known member
- Messages
- 371
- Likes
- 20
So what signs are you chaps looking for to go short? I assume also with a daily chart?
Mr Flibble
Well-known member
- Messages
- 371
- Likes
- 20
Thanks for that. I'm currently on my 6th trade now long for a few points..or so I hope looking for a target of 5619. Perhaps I need to take a step back and play these longer trends.
Got my money back for that silly revenge trade now shorting again from 5619.
wallstreet1928
Legendary member
- Messages
- 6,609
- Likes
- 89
Got my money back for that silly revenge trade now shorting again from 5619.
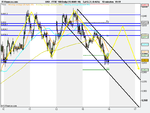
you may like this chart
FTSE 100 , 10 min
currently within a channel
MA pattern looming
Attachments
Similar threads
- Replies
- 0
- Views
- 1K
- Replies
- 14
- Views
- 5K


