Strategy development

zippy said:
Sorry I presumed that you would be able to locate 1-2-3 reversal on Nqoos' chart. I identified
1-2-3 on it but as you can see he was demonstrating other set-ups. Each to their own, eh?
Here are my comments on the chart, please advise if you agree. Thanks for your inpurt .
www.charts.dacharts.com/2004-11-18/nqoos-1-2-3-reversal3.png

Zippy,
I looked at the chart, and I still don't see your entry point..?
And, do you see that up bar, thats to the left of your #3? ( 9 bars to the left)

Is not that the first lower high?
 
Today, 11/19

It's days like today that makes all the work worth while. :)
 

Attachments

  • 1119 5m a.gif
    1119 5m a.gif
    23.4 KB · Views: 285
dbphoenix said:
Did you, personally, classify this as a retracement or as a reversal?

For me, this was a PB/RET from a BO through 80 area.

The 6:35 / 9:35 bar, being the bo bar.
 
Is not that the first lower high?

sulong said:
Zippy,
I looked at the chart, and I still don't see your entry point..?
And, do you see that up bar, thats to the left of your #3? ( 9 bars to the left)

Is not that the first lower high?

Yes that could be regarded as a lower high too- I'm looking for retracement of more than a few
bars for the formation of point C.
AB= 4152- 4139= 13 points
BC = 5 points

We will know that point C has been formed,once the price starts moving down. The short entry is at the point of small red arrow on the right of C. :p
 
retracement or as a reversal?

dbphoenix said:
Did you, personally, classify this as a retracement or as a reversal?

May I comment please?
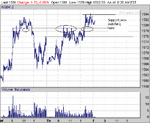
I see a strong resistance at 1580-1581ish area. When the high was tested the 3rd time
and failed, I would identiy the first leg down to 6:45ish as retracement and the failure
to take the high out at 1580 as a reversal. In another words reversal is @ 1572 about 7:00am.
Does that make sense? :p
 
Last edited:
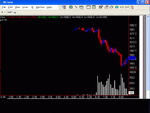
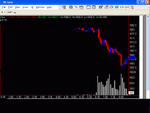
Here's what I was seeing this morning. 1st my pre trade chart, and then my real time chart.
edit. got the charts mixed around, but you get the point
My trade was based on a breakdown of support, as defined on my pretrade chart.

Refer to post #97
 

Attachments

  • 1119 5m a.gif
    1119 5m a.gif
    23.4 KB · Views: 258
  • 1119 pre b.GIF
    1119 pre b.GIF
    12.1 KB · Views: 284
Last edited:
How can one tell when a pullback is likely to result in an end of trend, as opposed to the hoped for continuation?

Here is my hard and fast rule:

If the trend is up:
If any part of the pullback's price drops lower by 1 tick or more than the most recent swing low, the original trend is now dead.

If the trend is down:
If any part of the pullback's price rises higher by 1 tick or more than the most recent swing high, the original trend is now dead.

This is useful information in my trading. I will cancel pending limit orders in these situations which often times saves me from getting stopped out in this particular situation.

Actually there is one caveat I have to mention: sometimes when this happens it really is a pullback, but of a higher time frame trend. In that case you would probably get stopped out anyways though because if you enter price will go against the direction you are in for a fair amount of time. So even in this case you want to cancel any pending orders or decide not to take them if you use market orders. In some cases you might want to enter after all, but only at a deeper point in the pullback.

Does anyone else have ideas for identifying patterns where a pullback is really a change of trend in disguise?

-Taric
 
This thread deserves to roll on for sometime.

Many thanks for working on all this in such a focused way. It's been a super read. The previous Price, (Volume), Support, Resistance, Demand and Supply thread was a cracker too. I've been putting the hours in and have enjoyed waking up the old grey matter with such chewy stuff.

e.g. "...demand, supply, support, resistance, buying pressure, selling pressure are all related, but distinct."

That's some puzzle to mull over.

tune
 
ptunic said:
How can one tell when a pullback is likely to result in an end of trend, as opposed to the hoped for continuation?

Here is my hard and fast rule:

If the trend is up:
If any part of the pullback's price drops lower by 1 tick or more than the most recent swing low, the original trend is now dead.

If the trend is down:
If any part of the pullback's price rises higher by 1 tick or more than the most recent swing high, the original trend is now dead.


This is useful information in my trading. I will cancel pending limit orders in these situations which often times saves me from getting stopped out in this particular situation.

Actually there is one caveat I have to mention: sometimes when this happens it really is a pullback, but of a higher time frame trend. In that case you would probably get stopped out anyways though because if you enter price will go against the direction you are in for a fair amount of time. So even in this case you want to cancel any pending orders or decide not to take them if you use market orders. In some cases you might want to enter after all, but only at a deeper point in the pullback.

Does anyone else have ideas for identifying patterns where a pullback is really a change of trend in disguise?

-Taric

The breaking of a TL does not end a trend in it's self. The price action that follows the break, will tell you if the trend has ended..
For me, trends have cycles, so knowing the cycle your trend is in at the moment, will have a great deal to do with the likelihood of whether or not your in for a PB or a reversal, or entering into a trading range..
 
sulong said:
The breaking of a TL does not end a trend in it's self. The price action that follows the break, will tell you if the trend has ended..

I'll have to study this further; the more I think about it the more that makes sense. I have been able to often use price/volume action following a break to determine when a trend starts; it is possible that instead of having different rules for pullbacks I should think a bit more universally and apply the same logic to pullbacks.


For me, trends have cycles, so knowing the cycle your trend is in at the moment, will have a great deal to do with the likelihood of whether or not your in for a PB or a reversal, or entering into a trading range..

Trend cycles might be one of my largest weaknesses in trading. I'm fairly accurate determining trend in the morning period not too far from the open. Also, I feel comfortable determining new trends after a range-bound (congestion) area. In both cases I look at price/volume action after s/r is broken. Where I get into many problems is when a trend has been moving in one direction for a fair amount of time (possibly with multiple pullbacks), and then gets into a sort of trendless state. Let's say a trend has been in effect for 1 to 1.5 hours and then goes into 10 minutes of trendless behavior. Then, let's say the price/volume has a favorable reaction to breaking a new s/r -- in the same direction as the previous trade. This is where I get a little confused as to what to do, as trends don't last forever, thus I perceive the risk of buying a top or selling a bottom greater if you enter after a trend has been going on for a while. Then again, maybe there was enough trendless activity to constitute this being a whole new trend. This is the kind of fuzzy area that I believe a knowledge of cycles (which I don't have) would be helpful. It is a question of when does the trend reset so to speak.

The only other cycle I'm aware of is trends seem to have the highest chances of continuation their first two pullbacks. The third and subsequent pullbacks are usually lower quality setups, though I sometimes make an exception to this if trend breaks a s/r level with very favorable price/volume activity. This isn't to say sometimes a trend will pullback and continue back and forth an entire day or longer, but generally speaking I avoid the third and later pullbacks... again the whole notion of a determing when a trend has paused, versus fully "reset" causes me problems. I believe there is some sort of cycle at work here but I have no idea what it is at this point.

-Taric
 
ptunic said:
How can one tell when a pullback is likely to result in an end of trend, as opposed to the hoped for continuation?
Volume gives a clue.

And using a bracket of timeframes round your trading timeframe helps.

As does sector, market and futures action.

I don't believe there is one (or more) 'hard and fast' rules - just useful guidelines that work more often than not.

As for 'hoped for continuation' I think that's a bit of pressure you're putting on yourself that you can do without. It will either will continue, reverse or consolidate. If you're 'hoping' you're more likely to read into the action what isn't there.

Let the price (& volume) tell you what the market's doing.
 
In a trend its a pullback while:

1) The last high vol/WRB (in the direction of the trend) is not beaten

2) No signs of weakness in the bars following the WRB, generally reducing volume (no interest in the anti-trend side) is a good sign.

3) Your maximum no. of bars has not being exceeded (depends on timeframe / personal boredom factor)

Why ?

The WRB (if not climatic action) is designed to lock out those on the sidelines wanting to get in and lock in the holders(so as to minimise resistance). Generally, they're aren't going to let you get in or out by beating the WRB unless they have anti-trend intentions.

Entry ? Depends on your style.

Or is this all rubbish ?

Porks.
 
One of the problems we have when we are trying to develop a workable strategy, is forcing ourselves to make a choice.
The one thing that I think everybody agree's on, is that all pb's/ret's are not created equal.
That being the case, we then need to chose (choose?) which pb/ret we are willing to risk our money on.
That's the idea behind this thread.

First find a great looking example of your ideal trade.
Break down the picture into before, during, after your ideal trade.
Study it, and write down the conditions that came before, and then during( your ideal entry), and then the results.
Keep it to 5 or 6 or 7 simple lines.
This is your base to work from.

Now you have something to begin back testing on, get your stats worked out.
And only then forward test it.

What will happen is, you will discover the principals at work, it'll hit you like a baseball bat to the forehead.

Who among us has the gonads to do this simple exercise?
 
sulong said:
Who among us has the gonads to do this simple exercise?

Being specific means assuming responsibility, and most traders will go to any lengths to avoid responsibility (it's so much easier to blame a bad trade on "them").

If the trader is not looking at real bars on real charts and annotating those charts, preferring instead to talk theory with liberal sprinkles of jargon, then he's not taking responsibility for his trades and trading.

Every new trader ought to have and maintain a collection of chart examples which show exactly what it is he's looking for. If he doesn't know what he's looking for, then he will by definition never be able to find it. These "pictures" may seem infantile to those with ego issues, but they are both necessary and essential.
 
About definitions.

I'm sure that sulong had hoped that this issue would have been clarified by now, but after 175 posts, it's still as murky as ever. So I'll try again to make the point.

For a trader, a definition enables him to make a choice. Defining a reversal as a change in direction, for example, or as a break of a TL or whatever, is useless. It says nothing about what the trader is supposed to do. A trader has to distinguish between retracements and reversals in a way that tells him what to do. If he hasn't done that, then he's wasted his time. And while I don't want to hurt anyone's feelings, waiting around for someone else to provide these definitions is characteristic of a loser. Why? Because that's not what a winner would do.

Similarly, it is not necessary for everyone to agree. It is not necessary even to reach a consensus. If the trader decides, for example, that trends do not exist within ranges, he is well within his rights to do so. After all, is the Traders' Local going to come over and shoot him? Similarly, he can decide that there is no such thing as a retracement within a range. He can decide that retracements occur only outside a range. He can decide that reversals occur only within ranges.

But he must decide. He must make choices. He must assume responsibility for the trade. Otherwise, he's wasting his time and his money.
 
Last edited:
dbp,

Chart examples, great idea.

Can you show us your definitions, or are these private ?

I don't know what others think, but whatever you say, I think showing your examples they would be useful.


Porks
 
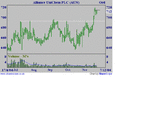
This really isn't my style of trading, but this thread is so interesting. Here's a set up I like and I have a buy order in @ 715 ( No, I'm not looking for comfort blanket comments :) just thought you'd like to see).

My reasoning:

The initial resistance in July was provided by the all-time high which was reached on high volume. The four subsequent attempts to breach his level were on lower volume, but higher volume than that prevailing at the time of the attempts. The final break through was on the highest volume for some time, albeit still below the July high volume and not much above those subsequent attempts volume. The pullback has been on markedly reduced volume.

If it pulls back further from here (without increasing volume) I'll trail my entry to the top of the subsequent pullback bars unless it goes back through the resistance level.

Feel free to criticise - it won't put me off the trade 'cos it's only "off plan" money.

good trading

jon
 

Attachments

  • aun.gif
    aun.gif
    11.7 KB · Views: 279
barjon said:
My reasoning:

1.The initial resistance in July was provided by the all-time high which was reached on high volume.
2.The four subsequent attempts to breach his level were on lower volume, but higher volume than that prevailing at the time of the attempts.
3.The final break through was on the highest volume for some time, albeit still below the July high volume and not much above those subsequent attempts volume.
4.The pullback has been on markedly reduced volume.

5.If it pulls back further from here (without increasing volume) I'll trail my entry to the top of the subsequent pullback bars unless it goes back through the resistance level.

Feel free to criticise - it won't put me off the trade 'cos it's only "off plan" money.

good trading

jon

Jon,
I put numbers on what I see as your steps, for taking this trade.
Does the volume pattern in #2 have to be present, for you to continue with your trade plan?

#3 highest volume in "some time". If the BO came on average, or below average volume, would that take the trade off the table, for you right there? and what is the minimum of "some time"?
 
Porks said:
dbp,

Chart examples, great idea.

Can you show us your definitions, or are these private ?

I don't know what others think, but whatever you say, I think showing your examples they would be useful.


Porks

I've already provided dozens of chart examples. Why not show an example of the setup you were describing earlier? You're going to be trading by your own definitions, so those are the only definitions that are pertinent to your trading.
 
Top