Some of my trades, forecasts

Status
Not open for further replies.
Gbp/nzd

My MR2 is on the radar at 2.2289. We, most likely will get the conventional monthly correction at that point. Afterwards, it will be preapred to put on its track shoes and be ready to test the bottom of the weekly cloud at 2.2527. Because of monthly chart implications, 2.5229 is on the LT radar.
 
Re: NZD/JPY trade

This might have been a mistake, but I took the trade out at 60.28 for +95 pips. 60.33 is my WS1, and I'm expecting a bounce. If I get it, then I'm back in for the rest of the ride to 59.83. If I don't get it, then I just lost some pips.


My other 5 positions are up by over 600 pips, so it has freed up some space to enter another position on the NZD/JPY, a short at 61.23, and a TP at 59.83, which is my MS2.
 
Eur/usd

The bears could be temporarily halted at 1.2671, which is the top of the daily cloud. Additionally, YS2 is 1.2640.
 
Gbp/usd

The pair could be at 1.5447 before the day is out. There is not much support on the larger TF's. The only obstacle is a cluster event at 1.5468 on the 4-hour.
 
Dang it Paul,
I broke my first rule of trading is which trading on my own analysis. I got out of my EUR_AUD with a very small profit....LOL
 
Dave, I hope you are able to get back in. Both of us know the UP is going to be huge.


Dang it Paul,
I broke my first rule of trading is which trading on my own analysis. I got out of my EUR_AUD with a very small profit....LOL
 
Dave, I hope you are able to get back in. Both of us know the UP is going to be huge.

I will get back in.....the one hour chart is just completing the first five waves of a zigzag. After looking at the charts on 3 time frames I realized you are probably right and the EUR_AUD will probably make one more low. So in Elliott Wave terms it is ready to drop in three waves now and go back up in five without making a new high over 1.4969. After that it should make one more new low but not below 1.3918..... I will be looking at the wave structure going down and will get in long at the most opportune time........
 
It doesn't sound like you hurt yourself by taking the small gain.
I was relieved to see my NZD/JPY position reverse before it hit my MS2 at 59.83. I took it out around my WS1. It would be nice to get back in around 60.80, then go for another ride. Oh well, wait and see.


I will get back in.....the one hour chart is just completing the first five waves of a zigzag. After looking at the charts on 3 time frames I realized you are probably right and the EUR_AUD will probably make one more low. So in Elliott Wave terms it is ready to drop in three waves now and go back up in five without making a new high over 1.4969. After that it should make one more new low but not below 1.3918..... I will be looking at the wave structure going down and will get in long at the most opportune time........
 
Usd/jpy

Accompanied, is a chart to show the cluster S for this pair on the hourly. Once it breaks through the TK, it should be moving fast, which should be just in time when the tempo picks up during London.
I'm long at 85.83. Target is cautiously the MR1 at 87.26.
BTW, ignore the blue lines on Mondays. They don't plot right on Mondays--long story short. The blue lines are always my dailies.
 

Attachments

  • usdjpy hourly.jpg
    usdjpy hourly.jpg
    79.3 KB · Views: 127
Last edited:
It is really funny how all of these pairs work together. Once we can master this then we can trade pretty well...But it changes constantly so a successful trader must always be hitting a moving target.........
 
Re: Usd/jpy

I added a stop at 85.55. This will get ugly just in case I'm wrong, so I had to do it this time.


Accompanied, is a chart to show the cluster S for this pair on the hourly. Once it breaks through the TK, it should be moving fast, which should be just in time when the tempo picks up during London.
I'm long at 85.83. Target is cautiously the MR1 at 87.26.
BTW, ignore the blue lines on Mondays. They don't plot right on Mondays--long story short. The blue lines are always my dailies.
 
Re: Usd/jpy

It'sgetting to comfortable under the cluster S area, so I closed it at 85.68 for -15 pips.

Looking at the longer time frame charts it does appear that I may have been wrong and this pair has some more downside. I really don't like being wrong.
 
Re: Gbp/usd

I was wrong here. There was a clear path to the level. I was also hoping for that to happen. I was ready to take my trade out at 1.5447, knowing the correction was impending. This correction should take us to the 1.5720--1.5767 area. Afterwards, it should be naother strong leg DOWN. The daily on most of the USD pairs look tired, but the weekly is busing at the seams.
Cable met the daily objective by finding support at the kijun, but is far from meeting the weekly objective. If a picture paints a 1,000 words, the chart is attached.
Just to clear something up. I was not influenced by peripheral sources on my losing trade today on the USD/JPY. I was alerted to a situation by someone else's view and then posted the obviation of the trade. Once that level was broken, then it was a no-brainer to take it out. There was no need to wait for it to hit my stop. I admit the trade was risky due to implications on the 4-hour chart. Oh well, I got the first losing trade of the month out of the way.

The pair could be at 1.5447 before the day is out. There is not much support on the larger TF's. The only obstacle is a cluster event at 1.5468 on the 4-hour.
 

Attachments

  • gbpusd daily.jpg
    gbpusd daily.jpg
    100.2 KB · Views: 126
Re: Usd/jpy

LOL! Who does? Humble Pie is the only pie I don't like eating. As a metaphor, my parents made me eat string beans when I was younger. I'd drown them in vinegar. It took the edge off. In being wrong on my trade today, I took the edge off. I reminded myself it was my 1st losing trade this month, and it was only 15 pips. Got some more vinegar?


[/B]
Looking at the longer time frame charts it does appear that I may have been wrong and this pair has some more downside. I really don't like being wrong.
 
Usd/chf

I never claimed to have arrived, as this pair will atest. Recent price action is not making any sense, at least to me it is not. Price was resting comfortably above the TK combo on the daily, with the weekly very OS. My thinking is the YP at 1.0358 will hold, and eventually we get the move UP we're looking for. Ironically, this is shaping up very similar to when it peaked at 1.1730. It seemed so long for the final formation for takeoff, but it finally did, as we all know. My analysis of the drop to 1.0930 can be seen on my blog, and then the continuation to where it is now is in this thread....somewhere. We are still on for the move to 1.0930, and beyond.
 
Re: NZD/JPY trade

As it turned out today's low was exactly 59.83, then we had the strong bounce from there. The correction still has not been made off the WS1. I'm waiting on it, because it will make for another excellent trading opportunity.
Regardless, it proved, at least on this trade, I was a better forecaster than trader, and my S&R's won out again.
The daily is starting to take on the appearance like it wants to have a meeting with the tenken at 61.40. The MS3 is 57.63. It is doubtful it will be hit. It could be hit next month, but that would be under another label. The 3's tend to get moody. They are indicative of a strong trend that would practically have had to start at the beginning of that time increment.
This is also an interesting statiistic regarding my S&R's. Since its creation in 2007, they 3 has never been hit in back-to-back time increments. Let's say 57.63 for the NZD/JPY does get hit before the month is over; then, do not count on the MS3 to get hit in September. It just won't happen.
Also, I have never known the extremities to get hit in the same increment. In other words, the R3 and the S3. There are a few following this thread that have followed me closely over the last 3 years, so feel free to correct me if I am wrong.


This might have been a mistake, but I took the trade out at 60.28 for +95 pips. 60.33 is my WS1, and I'm expecting a bounce. If I get it, then I'm back in for the rest of the ride to 59.83. If I don't get it, then I just lost some pips.
 
Weekly S&R's for Gold

I'm sleeping at the switch, Hari:
R3--1243.60
R2--1229.77
R1--1222.34
S1--1207.50
S2--1200.03
S3--1187.59

Watch out for the MR2 at 1228.60

BTW, if anyone else wants to take a set of my S&R's for a test ride, let me know. I'll publish want you want.
 
EUR/AUD weekly S&R's

Someone e-mailed me for the cross's weeklies. Wanted them privately. I'm publishing them here for anyone else that may be interested in looking at them:
R3--1.4556
R2--1.4434
R1--1.4361
S1--1.4231
S2--1.4140
S3--1.4018

Also, watch for the MS1 and MS2 at 1.4211 and1.4023, respectively.
 
Re: Eur/aud

Unlike my friend, Dave, at his thread EUR/USD Elliot Wave, I'm having trouble getting around this pair. First of all, my LT projection remains on the radar at 1.7525. For now, it seems a further dip is in store to the 50% mark of YS1--YS2 at 1.4131.
Considering my own methodology is not giving me a clear reversal signal, I'm going to cheat a little to get a conceptual idea of what to expect. I do not subscribe to Forex TRM, but am considering re-subscribing. This is very rough, but as have it figured out, -2 sigma is in the approimate area of the latter mentioned point. -3 sigma is in the approximate area of my 61.8% mark of YS1--YS2 at 1.3986. Either level represents a strong reversal point, and the lower, the better. The amth on that is rough, but in the ballpark. Maybe if someone subscribes to Forex TRM, you can confirm that for me, one way or the other.
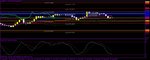
To give you an idea of what happens when a 2 or 3 point is hit on the sigma bands. Take a look at the EUR/USD. +3 was hit on it. The GBP/USD just touched +2. EUR/GBP hit +3 and blew up. AUD/USD hit +2, and look what happened last week. The EUR/AUD hit +3 when it peaked at 1.4968, and look where it is now.
Sorry, got to take some more timeout for sigma education, adn the strong coincidental parallel it has with my S&R's. Sigma bands measure the depth or the trend's range within its own decomposition. As far as my S&R's go and the EUR/AUD, we look for a 1,223-pip one-way trip. If that is exceeded, then we begin to look for a blowout, such as what is happening with many of the USD pairs right now. Sigma bands measure the same relativity, but in terms of a deviance from the median point, which for the EUR/AUD is currently circa 1.4468. The farther away from the median it pulls from the median, the more of a gravitational pull there is to get back to the median. Depending on the velocity of the move and the flow of the trend is depended on how dynamic the bands will be. When I refer to that, there is only a small relative deviance in the band movement. Right now, the EUR/AUD's bands are about level, because it has been trapped in a gigantic channel, so it becomes quite dependable as far as the reversal points are concerned, and then where the pair is headed. Unlike my S&R's which measures the yearly trend as 1,223-pip one-way trip, when we measure extremities on the sigma bands (that is from +2 to -2) we have a 1,328-pip one-way trip.
It is up to you to consider all that rhetoric to be enlightening or hogwash, but believe me, it is all relative to what we see will be going on with the pair.
I don't make a dime off of Forex TRM, but it is also another reason it is the only paid software program I highly endorse.

Paul, here you have the charts
 

Attachments

  • audeurb.gif
    audeurb.gif
    9.2 KB · Views: 123
  • audeurc.gif
    audeurc.gif
    9.3 KB · Views: 113
  • audeurd.gif
    audeurd.gif
    11.7 KB · Views: 129
  • audeure.gif
    audeure.gif
    5.8 KB · Views: 126
  • audeurt.gif
    audeurt.gif
    11.1 KB · Views: 115
Status
Not open for further replies.
Top