Some of my trades, forecasts

Status
Not open for further replies.
Gbp/usd

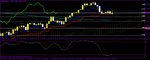
On the 1st bounce cable failed to hit the daily tenken. It is the daily chart that is now OS. With it resting on the kijun at 1.5561 (which is where I took my trade out for +47 pips), it should serve as solid enough support and we'll see the correction complete itself to 1.5764. I'll reenter, most likely at that point. Cable still has its eye on 1.5278. The weekly is still waiting to come apart at the seams.
 
GBP/USD trade

Went long at 1.5571. I usually don't like trading against a strong trend, but when the daily is this OS, and the tenken has not been hit yet, I should it's time to scoop up on some pips. It will be a conservative TP. I'll be quick to pull the trigger.
 
Re: Usd/jpy

I would expect this correction to top off at the top of the 4-hour cloud at 85.80, and then reverse to the MS2 at 84.65. From that point, we could see a sharp move UP to the weekly tenken at 88.09.

This might just be an outstanding call
 

Attachments

  • jpyusdt.gif
    jpyusdt.gif
    8.4 KB · Views: 142
  • jpyusdc.gif
    jpyusdc.gif
    9.2 KB · Views: 135
  • jpyusdb.gif
    jpyusdb.gif
    8.1 KB · Views: 145
Re: GBP/USD trade

Went long at 1.5571. I usually don't like trading against a strong trend, but when the daily is this OS, and the tenken has not been hit yet, I should it's time to scoop up on some pips. It will be a conservative TP. I'll be quick to pull the trigger.

You are a man with big "cojones"... I feel that this is going south, but I can also be wrong.
 
Last edited:
Re: Cad/jpy

Sounds like some bad English. TOH, I've had other typos. Just thought I'd let you know I am familiar with the English language. I do get in a hurry and overlook some things
Nuf sed--lol. Peak up to this point is 83.04, so we'll just sit and see what happens.

I like this call, "risk is on" on the short term so commodity ccys will gain strength agains jpy and usd.
On the cyclical TRM analysis we can see that the crossover on the short term chart (signal band) already took place and it is alligned with the mid term chart (trading signal), even when the green elipse is not at a safe -2 sigma, the red momentum line is just above the black momentum line, both going up. Also the long term chart (sigma band) is showing a momentum crossover at -1 sigma and the "center of gravity" (black trend line) at 84.91.

I love round numbers and trading between daily R&S levels. I would leave a pending order just above 83 with 1/2 TP below DR1 (83.40) and 1/2 TP below DR2 (83.98), but that is just my opinion.

Thanks for such a cool thread and inviting other people.
 

Attachments

  • jpycadt.gif
    jpycadt.gif
    9.6 KB · Views: 148
  • jpycadc.gif
    jpycadc.gif
    9.3 KB · Views: 133
  • jpycadb.gif
    jpycadb.gif
    8.4 KB · Views: 134
Re: Usd/jpy

My MS2 won't quite make the -2 sigma. It will still take some effort to get to because of the extreme downtrend.
BTW, you baited me on the CAD/JPY. It really looks tempting. If that 84.15 is hit, then it could get explosive on the reversal. The bands are very bearish, which means on the signal bands it could be +3, and bearish bands. It all adds up to a very nice short.


This might just be an outstanding call
 
Re: GBP/USD trade

This is not a trend reversal. It is what I consider to be a correction within the total scope of things that should take the pair to 1.5278. With the daily being so OS, and it was camping out on the kijun, I just thought it would be a good time to strike.
I do agree with you. If we get the correction I think we will get, then it hooks a U-y and heads back south--destination--1.5278.


You are a man with big "cojones"... I feel that this is going south, but I can also be wrong.
 
Re: Cad/jpy

Funny, I didn't know you psoted the charts here. When I was talking about this pair in # 606, I was only referring to the private conversation. I think your analysis is spot on with regards to what you saw on here. I don't think on this trip we'll get a crossover on the sigma band. When this correction is over, -2 sigma will be lower than the 79.99, because of the same obviations as its cousin, the USD/JPY. It does look inviting, though.
Thanks for your post! People reading this post are going to be beating the doors down at TRM, and James is not going to know what is going on--lol.


I like this call, "risk is on" on the short term so commodity ccys will gain strength agains jpy and usd.
On the cyclical TRM analysis we can see that the crossover on the short term chart (signal band) already took place and it is alligned with the mid term chart (trading signal), even when the green elipse is not at a safe -2 sigma, the red momentum line is just above the black momentum line, both going up. Also the long term chart (sigma band) is showing a momentum crossover at -1 sigma and the "center of gravity" (black trend line) at 84.91.

I love round numbers and trading between daily R&S levels. I would leave a pending order just above 83 with 1/2 TP below DR1 (83.40) and 1/2 TP below DR2 (83.98), but that is just my opinion.

Thanks for such a cool thread and inviting other people.
 
Re: Cad/jpy

BTW, 82.39 appears to be an optimal entry. That is the daily tenken. If it gets too comfortable under that point, then we will witness a false signal form our friends at Forex TRM. The bottom of the weekly cloud is acting as solid support for at least the last 2 weeks.

I like this call, "risk is on" on the short term so commodity ccys will gain strength agains jpy and usd.
On the cyclical TRM analysis we can see that the crossover on the short term chart (signal band) already took place and it is alligned with the mid term chart (trading signal), even when the green elipse is not at a safe -2 sigma, the red momentum line is just above the black momentum line, both going up. Also the long term chart (sigma band) is showing a momentum crossover at -1 sigma and the "center of gravity" (black trend line) at 84.91.

I love round numbers and trading between daily R&S levels. I would leave a pending order just above 83 with 1/2 TP below DR1 (83.40) and 1/2 TP below DR2 (83.98), but that is just my opinion.

Thanks for such a cool thread and inviting other people.
 
Re: GBP/USD trade

Well, I messed up. I took the trade out at 1.5553 for -18 pips.
That daily is so OS, and it was resting rather nicely on the kijun. This should now put 1.5447 in clear view.
I was going to take the AUD/NZD short, but I have a rediculous 20-pip spread.

Went long at 1.5571. I usually don't like trading against a strong trend, but when the daily is this OS, and the tenken has not been hit yet, I should it's time to scoop up on some pips. It will be a conservative TP. I'll be quick to pull the trigger.
 
Re: GBP/USD trade

Well, I messed up. I took the trade out at 1.5553 for -18 pips.
That daily is so OS, and it was resting rather nicely on the kijun. This should now put 1.5447 in clear view.
I was going to take the AUD/NZD short, but I have a rediculous 20-pip spread.

20 pips seems to be way too high, I'm seeing 8 pips in my brokers, I will PM you the names.
 
Re: Cad/jpy

BTW, 82.39 appears to be an optimal entry. That is the daily tenken. If it gets too comfortable under that point, then we will witness a false signal form our friends at Forex TRM. The bottom of the weekly cloud is acting as solid support for at least the last 2 weeks.

Mhh, it seems that you use ichimoku a lot, I never reallly paid attention to it but I will try to catch up with it so I can better understand your posts.

Is this a good link to learn about Ichimoku?
http://forums.babypips.com/free-forex-trading-systems/18471-ichimoku-trading-system-5.html
 
I know 20 pips is high. I have a demo account with 8 pips. I am satisfied with my broker, which is why I put up with their high spreads.
If the AUD/NZD moved like the GBP/AUD, then I wouldn't gripe.
 
Usd/jpy

After it made it clear we got a headfake in the 4-hour cloud, I went short ay 85.37. Hopefully, I wake up in the morning to some pips. After today's losing trade on cable, Tucker is chewing on his dog treat pretending it's my toe. Just joking. He's a good dog.
 
Re: Cad/jpy

BTW, 82.39 appears to be an optimal entry. That is the daily tenken. If it gets too comfortable under that point, then we will witness a false signal form our friends at Forex TRM. The bottom of the weekly cloud is acting as solid support for at least the last 2 weeks.

Mhhh, it seems that you use ichimoku as reference, I barely know about it and I need to read in order to be able to better understand your posts.

Is this a good link to learn basics about ichimoku?
http://forums.babypips.com/free-forex-trading-systems/18471-ichimoku-trading-system-5.html
 
Re: Cad/jpy

Funny, I didn't know you psoted the charts here. When I was talking about this pair in # 606, I was only referring to the private conversation. I think your analysis is spot on with regards to what you saw on here. I don't think on this trip we'll get a crossover on the sigma band. When this correction is over, -2 sigma will be lower than the 79.99, because of the same obviations as its cousin, the USD/JPY. It does look inviting, though.
Thanks for your post! People reading this post are going to be beating the doors down at TRM, and James is not going to know what is going on--lol.

Yes - I think it is funny that you emailed me at at the same time telling me that it looks hot to go UP.
With my analysis I'm not looking to hit home-runs, I look for strategic places to enter where the risk is lower, ie. leaving a pending order before a breakout. If the price action proves me right then I enter the trade, if I'm wrong, then the trade doesn't take place.
If James is not against that we are discussing the charts here, then I will post some more charts here, let me know if you want to see any particular chart.
 
Re: Cad/jpy

I don't use the ichimoku as a reference. It is the cornerstone of my methodology. My S&R's are my pride and joy, and I also use the 200 MA and the stochastics.
Baby Pips is a nice starting point for beginners. I once posted an ichimoku on their sight, and tied them in knots. BP does not use the ichimoku cloud.
I have a series on the ichimoku cloud in this thread. I also have a series on my blog at 4xpipcounter.blogspot.com. Look around Oct. 2007, and there you should find the beginning. I also have a series in there on the useage of my S&R's.

Mhhh, it seems that you use ichimoku as reference, I barely know about it and I need to read in order to be able to better understand your posts.

Is this a good link to learn basics about ichimoku?
http://forums.babypips.com/free-forex-trading-systems/18471-ichimoku-trading-system-5.html
 
Re: Cad/jpy

The only thing James would have any say on is what we discussed in our private e-mail. OTT, you cna feel free to post the TRM charts on my thread all you want. I am seriously thinking about resubscribing. If I do, then believe me, there will be a lot more TRM charts posted on my thread.


Yes - I think it is funny that you emailed me at at the same time telling me that it looks hot to go UP.
With my analysis I'm not looking to hit home-runs, I look for strategic places to enter where the risk is lower, ie. leaving a pending order before a breakout. If the price action proves me right then I enter the trade, if I'm wrong, then the trade doesn't take place.
If James is not against that we are discussing the charts here, then I will post some more charts here, let me know if you want to see any particular chart.
 
Re: GBP/USD trade

We already know I got out of this trade. It proves once again how your forecasts can be right, but your trading, well....
The daily tenken at 1.5746 still has not been hit, so I'm still waiting for that to happen.
Notice how the opens and closes are trapped on top of the kijun (red line). 1.5584 is the 50% of YP--YS1, which is forming a cluster around that area. The stochastics is showing how OS the pair is.
The objective for the OB condition was fulfilled when the kijun was hit. Now, the tenken has to be hit in order to fulfill the objective for the OS.
This will lead to another monster move south, as the weekly is still OB, which means 1.5278 still needs to be hit.
Dany, the move to 1.5746, I wold be surprised if your cirvilinear envelope did not indicate this to some effect.
I would also be surprised if the 1.5746 was not close to the +1 sigma, adn the 1.5278 was not close to the -1 sigma. There is also potential for cable to go lower than 1.5278.

Went long at 1.5571. I usually don't like trading against a strong trend, but when the daily is this OS, and the tenken has not been hit yet, I should it's time to scoop up on some pips. It will be a conservative TP. I'll be quick to pull the trigger.
 

Attachments

  • gbpusd daily.jpg
    gbpusd daily.jpg
    94.1 KB · Views: 137
Status
Not open for further replies.
Top