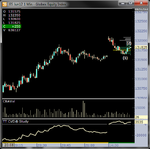
S&P 500 & other indexes - intraday. Plus chat

Good morning everyone

3:00am EUR French Flash Manufacturing PMI 47.1 46.9
3:00am EUR French Flash Services PMI 45.8 45.2
3:30am EUR German Flash Manufacturing PMI 47.1 46.2
3:30am EUR German Flash Services PMI 51.9 52.2
4:00am EUR German Ifo Business Climate 109.4 109.9
4:00am EUR Flash Manufacturing PMI 46.1 45.9
4:00am EUR Flash Services PMI 46.9 46.9
4:30am GBP Revised GDP q/q -0.2% -0.2%
4:30am GBP BBA Mortgage Approvals 32.3K 31.9K
4:30am GBP Prelim Business Investment q/q 3.2% -3.3%
4:30am GBP Index of Services 3m/3m 0.2% 0.2%
7:15am GBP MPC Member Miles Speaks
8:30am CAD Corporate Profits q/q 9.0%
8:30am USD Core Durable Goods Orders m/m 1.1% -0.8%
8:30am USD Unemployment Claims 372K 370K
8:30am USD Durable Goods Orders m/m 0.5% -4.0%
9:00am EUR ECB President Draghi Speaks
9:00am EUR Belgium NBB Business Climate -10.6 -10.7
9:00am USD Flash Manufacturing PMI
10:30am USD FOMC Member Dudley Speaks
10:30am USD Natural Gas Storage 77B 61B
1:00pm USD FOMC Member Dudley Speaks
3:00pm USD Treasury Sec Geithner Speaks

7:30pm JPY Tokyo Core CPI y/y -0.5% -0.5%
7:30pm JPY National Core CPI y/y 0.1% 0.2%
 
Nothing for me yesterday, I had a brianwave, a 5 minute job that kept me busy from 4pm to midnight.

For the ES if we look back from 17th to the current time, we seem to be balanced with 'value' between 1296.72 and 1316.75.

Ideally, it'l move up to 1321.25 or 1326.75 for a short down to 1296. That move down may have already started though and so it might just be a case of selling the bounce on the way down.

If we get down to 1295.75, I'll be looking for longs to g back up to the top of the range.

Of course, I'll still scalp, just looking for longer term reasons to have some bias.
 
This morning's chart so far
 

Attachments

  • S&P 500.PNG
    S&P 500.PNG
    117.5 KB · Views: 148
Another 2 minute chart to show progress. I haven't posted the 2 trades I did.
 

Attachments

  • S&P 500.PNG
    S&P 500.PNG
    122.5 KB · Views: 167
a. ONH 1323.50, ONL 1306.00
b. Note the buying ledge at 1316 from ON trade and the fact that the gap close is at 1316.00..........
c. ON VPOC 1321.50, NVPOC 1325.25
d. Delta +ve at open, 430k CBAVOL, OAOR to upside and out of balance
e. This is creepy, creepy, pokey, pokey tentative downward aha movement
f. ok it's tentatively testing downside here for buyers
g. 16 looks like the candidate area for action
h. Struggling to make it lower than 16.50
i. Long, market order at 1316.50 @ 14:40GMT (1) - Scorchio entry!
j. Climbing up but it's not got a lot of conviction, watch for sellers coming in
k. VPOC is around 1317.50, watch it here
l. struggling around here, look for a few ticks now
m. Out, market order at 1318.00 @ 14:43GMT (2) - not a bad exit if I say so
n. 6 ticks profit before commissions
o. MAE 0 ticks, MFE 11 ticks, exit efficiency 54%
p. Nice end to the week, take tomorrow off.
q. Today's opera - Actéon by Charpentier
r. No coffee today, forgot.
 

Attachments

  • ES210524.png
    ES210524.png
    40.7 KB · Views: 120
Nice trading but this really stood out 🙂

Have a great weekend!

Peter

I caught myself thinking about the lack of coffee at roughly the same time as price was struggling around 16.50. I attribute todays success to this simple fact.

Have a good weekend Pete, see you Monday.
 
Nice trade Robster

No trade for me today and quite happy I managed to resist to be honest. Didn't see any good setups so was happy to stay out. Work being very busy helped keep me distracted too.

Have a good weekend!
 
3:15am CHF Employment Level 4.05M 4.04M
4:00am EUR Italian Retail Sales m/m -0.1% 0.6%
9:55am USD Revised UoM Consumer Sentiment 77.7 77.8
9:55am USD Revised UoM Inflation Expectations 3.1%


Not much on today
 
A 1 hour chart to get the juices started !
 

Attachments

  • S&P 500.PNG
    S&P 500.PNG
    122.8 KB · Views: 141
I think some of you know that I am interested in how FuturesTrader71 (FT71) trades and I have a look at his tweets after I have finished trading. I thought this little nugget summed up how I feel about trading:

"Homework is whr logic lives. its where U do yr thinking. Entry is an art. Art isn't pretty when U think 2 much abt each stroke"

One aspect of trading that took me a long time to shake off was the focus and almost religious like fervor about entries and accuracy of entry. Now I am not saying entries are not important; A well timed entry not only mitigates risk substantially but also reduces in-trade mgmt overhead as the trade tends to look after itself (well at least until the exit).

For most mortals though, you aren't going to nail your entry and exit bang on and therefore you have to rely upon in-trade mgmt which is based upon a wider market view.

If you do not have a holistic view of how price is behaving then you will not be able understand whether you are in a good or bad situation commensurate to your risk appetite. This is comparable to driving around at night and then somebody turns the lights off. You have 2 choices. Stop the car (which is what most people do by getting out of the trade) or turn the lights on, ascertain what is going on and make a choice to continue or not. If you have done your homework and operate with lights on all the time, mistiming your entry isn't the beginning and end of your trading world.
 
i am trader and i have get some tips from this forum so i like it very much, but now i wan to discuss some point about trader in which i have some problems..
 
Just depends how you trade Rob - scalpers would say that entry is pretty much everthing.

Obviously, the longer your horizon, the more leeway on your entry.

My reversal points for yesterday were 1321.25 or 1326.75 and I think we initially went to 1323 and later 1325. For me, this is fine, I don't expect to nail it bang on in terms of my options for premise of the day. I just find it helps to actually have a premise (as FT71 says).

You mention using the DOM to refine your entry. In the case above, I could do three things based on the DOM.

First, I could look out for signs of reversal as it comes into my zone. That requires a fair amount of luck. What you effectively need to see there is either the buying fade or someone step up on the offer and absorb the selling. Neither of those is really a great reason to take a short at the high of the day in my opinion, it's too hit and miss. Obviously, there are times when you can hit that as the message is so strong.

The second signal to see when you get into your zone is for sellers to come in, in force. This will move price down and will see you go short at a lower price. Effectively, the cost of confirmation is a number of ticks.

The third signal is the pullback. You have the bounce off your level, you have a move down, you have a smaller move up. This time, the buying fade or the sellers absorbing on the offer is a much stronger signal to trade off and in fact, you can short based on that and nail an entry. You are no longer looking for a top and the odds are a bit more in your favour.

Now - with all of the above, you are going to bail way before a trade goes offside 16 ticks. With your trading, how do you discern between 'managing a trade' and 'hoping it comes back' ?

Also - how are you utilizing the DOM for your entry right now? It would seem that if you are having trades go offside a significant amount, you might as well trade off the levels themselves and ignore the DOM.

Finally - have you considered adding more contracts as you go offside? If you have the history and confidence, you are actually going to improve your entry price by adding more. I don't mean adding more forever - but something planned and where you only add as long as you remain confident.

These are not criticisms of your trading style, rather a discussion with a fellow trader. I am genuinely interested and not looking to score points or anything.
 
I never take any dialogue with you as point scoring DT. 🙂

I'll try and set some context first before trying to explain how I use DOM/T&S/MP and Chart and how things switch importance dependent on what is going on.

I go into each session with a view of what would constitute a movement outside of my frame of reference. For me the ON High and Low represent the extremities of where people were prepared to trade which includes the view of the Asian and European push/pull on the US indices. A lot of the time in the first 90mins of US RTH, ES will trade within this boundary and be constrained by it. On OD/OTD/ORR days it doesn't but these are the exception rather than the rule.

When price breaks out of the ON High or Low in the RTH session, this is my signal to get out but I need to see it break out of these extremities with some gusto - hence me generally getting run over on trend days.

So in layering the trades, the process is:

a) Do I believe this to be the current RTH High or Low and where is this in relation to the ON High or Low?

- I will use buyers/sellers drying up on T&S and have watched the general thickness/thinness and propensity to pull orders on DOM to ascertain whether to get in or not, usually with about 30s to 1m of confirmation required if it a LVN. This is x-referenced on a 1m chart. VAP & delta is monitored closely.

- I will use activity and what looks like the high volume traded on T&S with continued reloading at bid/ask on DOM if it is an area of known liquidity like the ON VPOC or a previous NVPOC. This is x-reference on a 1m chart. VAP & delta is monitored closely.

In the event I get this right, I get out with a low level of fuss.

b) If the initial trade is going against me after I have entered, I will look for the ON High or Low as my next point of reference. The distance it is in relation to entry is usually a function of current market volatility/average range. This is hugely important context which I never specifically discuss.

- ONH/ONL are usually (but not always) LVN's and there is a certain price action apparent primarily on T&S/1m chart and VAP.
- If price pushes through it and you see T&S drying up, you know to fade the move.
- If price pushes through it and T&S does not dry up, it might dry up a little further out and is commensurate with the current level of volatility - this is a judgement call based upon T&S usually and looking at 1min chart. DOM doesn't feature much in this one.
- If it keeps driving, then I am wrong and I should take an early bath.

If I am already offside, then I will increase risk and scale in if I believe this is an extreme of price. Frequently this occurs and the act of moving the average price in my favour means that if this just ends up being a pullback rather than a change of directional conviction, I can generally get out at scratch/with a small profit. I will scale in to make average price be favourable in relation to where a new, viable and conservative target will be. Most times an additional 1 x risk will do it.

If it goes against me, I get run over with a relatively heavy loss of the order of about 16-20 ticks on 2 x risk.

So basically I am believer in doing the opposite to what is 'taught':

I don't trade with a stop and take responsibility for when I am wrong
I will press risk when things are going against me rather than back off
I will scale/average in to create a new composite entry price, starting from a trade set-up that worked out wrong and adapt to a different view of the world/trade hypothesis to obtain a profit.

Make sense?

For the avoidance of doubt on Tuesday as an example, trade 1 was normal, trade 2 moved into hope, trade 3 was mgmt. Trade 2 made it a bad trade.
 
Last edited:
This may be a stupid question but does your DOM give you the figures of how many contracts are waiting to be filled and at what price ? For instance if you see there is a big buy-in figure just 3 points above it could help one select your levels and amounts.
 
This may be a stupid question but does your DOM give you the figures of how many contracts are waiting to be filled and at what price ? For instance if you see there is a big buy-in figure just 3 points above it could help one select your levels and amounts.

Yes it does but trusting it is another matter.

DT might be able to give you a more coherent view on this. My opinion is that the DOM is useful in and around the current bid/ask and maybe 1-2 ticks around this. Personally the clue is whether levels constantly reload under volume (telling me somebody with money likes the price) or don't (market will likely move in current direction until nobody wants to trade).

I don't think it is viable to trade just off DOM - you need T&S too. DOM is available liquidity, T&S is the consumption of the liquidity. Both together tell a story. The imbalance causes price to change. Flow of money predominantly in one direction causes it to change in the form of a trend.

So if you see a unusually large number of contracts some way from the current price action, I generally note it but don't place emphasis on it. My point of reference that far out is known points of liquidity (Volume at Price and composites of this) and MP/Price charts which tell me where people changed the direction of price and money flowed into and out of the market.

Clear as mud?
 
Back
Top