S&P 500 & other indexes - intraday. Plus chat

I didn't trade yesterday but it seems I missed a trend-day. These are the days when I tend to get run over and take a loss. It is a consequence of playing reversals off the extremities of the understood trading range set either by the overnight high/low and/or the RTH high/low.

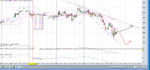
So as a good example of how it occurs, I've marked up probably how I would have traded and got taken out.

In the first instance, I would have seen weakness at the ONH with plenty of contract trading at that level, giving me a sense that sellers are coming into the market and counter-acting buyers.

Secondly price would have dropped by about 4-5 ticks thus convincing me that a general threshold has been hit that tells me it will go further.

Thirdly and finally, I assume it is coming back for a re-test of the new high to double check that nobody wants to buy and then bang it just ploughs through. I then take a loss as it is now trading outside of it's ON range with buyers wanting to trade at higher prices. How much of a loss I take depends on how quickly this occurs and what T&S looks like.

Anyway, thought I'd just post this up.

At least you can see your mistakes and therefore take the appropriate action !
Well hopefully
 
Interesting day today.

Had the charts off last week and a bit reticent to switch them back on today but did and decided at the same time to simplify them a bit.

Here's what I ended up with on Ninja:

ChartSetup-1.png


And on Investor R/T

IRTChartSetup.png


Basically, I want as little as possible on the charts, I'm mostly interested in the swings, so I figured I'd put the swings on and leave the price off.

Ninja - looks good,I like the swing granularity better but it's not good at plotting the current swing (which isn't an issue to be honest), so I put in the dotted like at current price. I have Ninja showing swing size & swing volume.

IRT - not so granular & without the option to put swing volume & price. Not sure which I like best tbh. IRT has other stuff I do like - such as it is better at getting the historical delta.

This AM focused more on the setup than trading. You know how it is when you start tinkering. The market seemed pretty slow, so I played like a range day, hence my last trade catching the bottom but missing most of the up move. My expectation was a move back to the bottom of the range.

Now, I've lost my connection to the market with all that screwing abt with the charts, hence coming over here & posting. Now, I'll call it a day.

Longer term, I think we might balance for a few days now, if so, I'd expect a bounce off 1308 or 1313.25 later on and a move back down.

Those lines on NT look suspiciously like the zizag indicator ?
 
3:00am CNY CB Leading Index m/m 0.8% 0.8%
4:00am NZD Inflation Expectations q/q 2.4% 2.5%
9:30am GBP CPI y/y 3.1% 3.5%
9:30am GBP Public Sector Net Borrowing -8.5B 15.9B
9:30am GBP RPI y/y 3.5% 3.6%
9:30am GBP Core CPI y/y 2.2% 2.5%
9:30am GBP HPI y/y 0.5% 0.3%
Tentative GBP BOE Inflation Letter
11:15am USD FOMC Member Lockhart Speaks
3:00pm EUR Consumer Confidence -20 -20
3:00pm USD Existing Home Sales 4.62M 4.48M
3:00pm USD Richmond Manufacturing Index 12 14


trade with patience ( love that girl )
 
Easily done Rob - the delta shift in the first 30 mins was very small. When I see the delta go +4000, -4000 like that, I do not expect it to trend.

When it did break to the upside, I wasn't in on it but it's not really a big issue because we sure started off like a range day.

Some trend days are obvious. they are like is straight out the gate. For those like yesterday, I'm happy to not get my pants pulled down.
 
LONDON (ShareCast) - Security: Support/Resistance

EUR/USD: 1.2620/1.2919. IBEX35: 5,950/7,208. FTSE100: 5,075/5,585. S&P 500 (SNP: ^GSPC - news) : 1,290/1,346. NIKKEI 225 (Osaka: ^N225 - news) : 8,135/9,380. HANG SENG INDEX: 17,821/21,086. DOW JONES (DJI: ^DJI - news) : 12,250/12,690. NASDAQ 100 (Nasdaq: ^NDX - news) : 2,474/2,643. CAC (Frankfurt: 924169 - news) 40 Fut.: 2,932/3,191. DAX XETRA Fut.: 6,199/6,700. EURO STOXX50 Fut.: 2,066/2,254. JR
 
Those lines on NT look suspiciously like the zizag indicator ?

That is exactly what they are. Well - actually, it's the "PriceActionSwing" indicator which is ZigZag with hairs on it's chest.

Anyway, I have finally managed to take price off the chart!

I really am only interested in the swings and so I decided to just have them on there for reference. That way I don't lose focus.

I originally intended to write some code to paint 1 bar per swing. So a swing up is a bar and a swing down is a bar. I may do that at some point but it's a lot of screwing about for not much additional benefit.

The other interesting thing is it gives volume on each swing and whilst I have not decided to use it, it is an interesting reference point.
 
Easily done Rob - the delta shift in the first 30 mins was very small. When I see the delta go +4000, -4000 like that, I do not expect it to trend.

When it did break to the upside, I wasn't in on it but it's not really a big issue because we sure started off like a range day.

Some trend days are obvious. they are like is straight out the gate. For those like yesterday, I'm happy to not get my pants pulled down.

I know what you mean but even on obvious trend days I get run over too :p

From 12th April

134600d1334247149-s-p-500-other-indexes-intraday-plus-chat-es210412.png
 
Here is a 2 min chart with 2 possibilities.
 

Attachments

  • S&P 500.PNG
    S&P 500.PNG
    118 KB · Views: 183
Bit of a race to get this posted before I get stopped out - stops @ B/E after first 2 targets. Now waiting to see if we get for another breakdown.

May22nd1.png


current price is the horizontal dotted line. Sort of odd not having the current price on the chart but suits me. Out for dinner tonight, so probably wont trade the US session, hence the cheeky afternoon trade.
 
After yesterday's up day, am expecting consolidation in a small range and therefore mean reversion trades would be the order of the day.
 
Dinner booked, wife informed, so off to Basilico to celebrate another year with low cholesterol & other generally good readings on the check-up.

All are invited, dinners on me - see you in Sukhumvit 33 in 60 minutes.
 
Dinner booked, wife informed, so off to Basilico to celebrate another year with low cholesterol & other generally good readings on the check-up.

All are invited, dinners on me - see you in Sukhumvit 33 in 60 minutes.

Lunch here with a bag of crisps
 
C'mon market - must be near the bottom ?
 

Attachments

  • S&P 500.PNG
    S&P 500.PNG
    116.4 KB · Views: 208
I signed up today for a free 15 days with Sierra Charts.
Here is my first chart. Looks OK to me. Anyone use SC ?
 

Attachments

  • S&P 500.PNG
    S&P 500.PNG
    65.9 KB · Views: 255
I used Sierra ten years ago with IB. They provided the data. I had no problems, then. Now I use SB and the charts it supplies. It is all down to the data provider.
 
I used Sierra ten years ago with IB. They provided the data. I had no problems, then. Now I use SB and the charts it supplies. It is all down to the data provider.

What I am really interested in is their spreadsheet. I hope to explore this bit more later.
 
Top