S&P 500 & other indexes - intraday. Plus chat

I have no problems answering questions, ask away :)

Mind over Markets will get you tuned into a view of how to model the markets behaviour by modelling it as an auction. It is independent of the timeframe you will eventually trade. Check out John Grady's NoBS Trading if you are interested in trading purely off DOM and FT71 if you want a more holistic view of how to trade auction market theory. I find FT71 more in line with how I trade and he posts up some interesting views which demonstrate a depth of understanding that transcends my exposure to ES.

I trade by looking at 3 things with emphasis shifting on what I am looking at dependent on circumstamces:

1) T&S - this tells me what the order flow is doing
2) DOM - this tells me about the available liquidity that is being consumed
3) Charts - the 1m/5m is most useful when in action but the 30m,60m & 1d for context

So the platform I chose to use was x_trader and I use Velocity Futures. Prices vary based upon number of contracts traded and number of exchanges/feeds you want to trade but to do ES alone with velocity using their baked in x_trader then you are paying about $4.50 per RT per contract. This is of course negotiable. Costs drop significantly if you pay for x_trader yourself and number of contracts hike up but I would not suggest committing to this until it is financially worthwhile.

I have seen the IB have a comparable offer using their own proprietary trading platform so I would probably give that a whirl too as people rate them as a broker.

My personal opinion is that you will have an informational edge by trading an exchange traded product where you have visibility of the order book and order flow compared to the normal retail trading approach of using a chart alone. As markets generally reward you for having better information (providing you know how to filter it and trade it) then it should be relatively obvious why most institutional traders use x_trader and other similar platforms.

Good luck. Let us know how you get on and post some of your trades up here - all are welcome.

Many thanks for all the info Robster... given me lots of research to do!

Have a great weekend all.
 
12:01am GBP Rightmove HPI m/m 0.0% 2.9%
4:00am NZD Credit Card Spending y/y 3.7% 5.3%
5:30am JPY All Industries Activity m/m -0.3% 0.0% -0.1%
6:45am CHF SECO Consumer Climate -8 -15 -19
8:00am GBP MPC Member Posen Speaks
10:15am USD FOMC Member Lockhart Speaks
All Day CAD Bank Holiday


Not much in the diary today
Interesting to see how Face Book does today though
 
Here is the 5 min chart
 

Attachments

  • S&P 500.PNG
    S&P 500.PNG
    101.1 KB · Views: 150
Well it didn't go that way this time
 

Attachments

  • S&P 500.PNG
    S&P 500.PNG
    103.6 KB · Views: 167
..


PARIS, May 21 (Reuters) -

* U.S. stock index futures pointed to a higher open on Wall Street on Monday, with futures for the S&P 500 (SNP: ^GSPC - news) up 0.85 percent, Dow Jones (DJI: ^DJI - news) futures up 0.49 percent and Nasdaq 100 (Nasdaq: ^NDX - news) futures up 0.79 percent at 0842 GMT.

* European stocks were up 0.5 percent in morning trade on Monday following a dismal week, but gains were capped by lingering worries over the future of Greece into the euro zone.

* On Saturday, G8 leaders stressed that their "imperative is to promote growth and jobs" and gave verbal backing for Greece to stay in the euro, but despite calls from the United States for immediate moves to boost growth, no sign emerged that Germany would soften its stance on austerity as the cure for Europe (Chicago Options: ^REURUSD - news) 's debt problems.

* Yahoo (NasdaqGS: YHOO - news) will be in the spotlight after news that Chinese Internet entrepreneur Jack Ma is buying back up to half of a 40 percent stake in his Alibaba Group from Yahoo for $7.1 billion, in a deal that moves the Chinese e-commerce leader closer to a public listing.

* Newly issued shares in Facebook Inc may have a hard time in the coming week if lead underwriter Morgan Stanley (EUREX: DWDF.EX - news) stops supporting the stock and managers lower down in the IPO book who were hoping for an early surge decide to get out before going underwater.

* Wanda Group, one of China's largest theatre owners, has agreed to buy AMC Entertainment in a deal valued at $2.6 billion, creating the world's biggest cinema operator, the companies said.

* Chinese traders have defaulted on some thermal coal contracts following a drop in prices over the past month, traders said on Monday, providing more evidence that a slowdown in the world's second-largest economy is hitting the appetite for commodities.

* The coal defaults also come after sources at steel mills and traders said last week that some iron ore shipments had been postponed. China is the world's biggest consumer of iron ore, coal and other base metals, but recent data has shown the economy cooling more quickly than expected.

* The chief executives of Apple Inc (NasdaqGS: AAPL - news) and Samsung Electronics Co Ltd come face to face on Monday in court-directed mediation in the United States over a dispute in which the iPhone maker claims the Korean firm has "slavishly" copied some of its products.

* U.S. stocks fell on Friday after a sloppy debut by Facebook Inc spoiled hopes that a spectacular open for the most-anticipated stock sale in years would brighten the mood in what has been a gloomy month for equity markets.

* The Dow Jones industrial average dropped 73.11 points, or 0.59 percent, to 12,369.38. The Standard & Poor's 500 Index lost 9.64 points, or 0.74 percent, to 1,295.22. The Nasdaq Composite Index fell 34.90 points, or 1.24 percent, to 2,778.79. (Reporting by Blaise Robinson; Editing by Toby Chopra)
..
 
Hi Pat, I know you're focusing on short term intraday trades with this thread, but I thought I'd post a weekly chart of ES that shows that the current pullback is only just reaching the 61.8% fib level. So from a longer term perspective the current price action it's still a normal pullback in an uptrend so far imo.

attachment.php
 

Attachments

  • ES_Weekly_21_5_12.png
    ES_Weekly_21_5_12.png
    23.4 KB · Views: 477
Interesting chart Isatrader. From it It looks like 1240 ish will be the bottom ?
 
Face Book down 13% !!

With Morgan Stanley reputed to own 2billion at $38 !!
 
Interesting chart Isatrader. From it It looks like 1240 ish will be the bottom ?

The way I see it personally when looking at the levels is when you have a strong uptrend the 61.8% level is frequently the pivot point zone for a secondary move higher to retest the recent high. If, however it drops to the 50% level, which is around 1245 level or lower then the bulls are weaker and a new high is less likely in the near term. So I kind of use it as a price action momentum tool, as if the uptrend momentum is strong then it will bounce at 61.8%, but if it doesn't then the momentum part of the move would be over imo.
 
Interesting day today.

Had the charts off last week and a bit reticent to switch them back on today but did and decided at the same time to simplify them a bit.

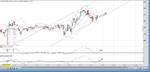
Here's what I ended up with on Ninja:
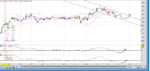
ChartSetup-1.png


And on Investor R/T

IRTChartSetup.png


Basically, I want as little as possible on the charts, I'm mostly interested in the swings, so I figured I'd put the swings on and leave the price off.

Ninja - looks good,I like the swing granularity better but it's not good at plotting the current swing (which isn't an issue to be honest), so I put in the dotted like at current price. I have Ninja showing swing size & swing volume.

IRT - not so granular & without the option to put swing volume & price. Not sure which I like best tbh. IRT has other stuff I do like - such as it is better at getting the historical delta.

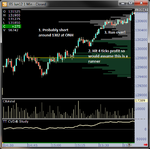
This AM focused more on the setup than trading. You know how it is when you start tinkering. The market seemed pretty slow, so I played like a range day, hence my last trade catching the bottom but missing most of the up move. My expectation was a move back to the bottom of the range.

Now, I've lost my connection to the market with all that screwing abt with the charts, hence coming over here & posting. Now, I'll call it a day.

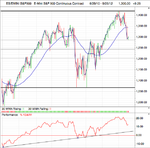
Longer term, I think we might balance for a few days now, if so, I'd expect a bounce off 1308 or 1313.25 later on and a move back down.
 
Just thought I'd add this. Not an inspiring day but looking at the report, I noticed something that made me smile:

MAEMagic.png


Second trade went totally against me 5 ticks by the time I got out - 5 ticks * 5 contracts = 6.25

All of the other trades, MAE of zero ticks. Total fluke. Looks epic though. I think that MFE is off though - I scale out @ 4 ticks, so that MFE on the 3rd trade implies I was +3 points with all 5 contracts which didn't happen.
 
But the indices seem ok, UStech, at least. I've just got out of a buy for 29 points.
i did not do so well with Footsie, this morning, though, I decided that the thing to do was to short. :(

But, I'm within a whisker of getting it all back, now. :)
 
I didn't trade yesterday but it seems I missed a trend-day. These are the days when I tend to get run over and take a loss. It is a consequence of playing reversals off the extremities of the understood trading range set either by the overnight high/low and/or the RTH high/low.

So as a good example of how it occurs, I've marked up probably how I would have traded and got taken out.

In the first instance, I would have seen weakness at the ONH with plenty of contract trading at that level, giving me a sense that sellers are coming into the market and counter-acting buyers.

Secondly price would have dropped by about 4-5 ticks thus convincing me that a general threshold has been hit that tells me it will go further.

Thirdly and finally, I assume it is coming back for a re-test of the new high to double check that nobody wants to buy and then bang it just ploughs through. I then take a loss as it is now trading outside of it's ON range with buyers wanting to trade at higher prices. How much of a loss I take depends on how quickly this occurs and what T&S looks like.

Anyway, thought I'd just post this up.
 

Attachments

  • ES210521.png
    ES210521.png
    46.9 KB · Views: 162
Top