You are using an out of date browser. It may not display this or other websites correctly.
You should upgrade or use an alternative browser.
You should upgrade or use an alternative browser.
'No indicators' revisited
- Thread starter ford
- Start date
- Watchers 53
- Messages
- 2,325
- Likes
- 17
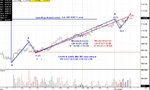
Having a few data issues at the moment, but we've just had a nice double top at 1118.00 (previous one was Friday), and are now in a pullback.
Likely to try to bounce at 1113 (on the gap formed this morning).
On the 5 min we've just had a mini h&s, with 3pts from neckline to top. So 3pts down from right shoulder gives 1113.5 - so two things coinciding in that area.
Likely to try to bounce at 1113 (on the gap formed this morning).
On the 5 min we've just had a mini h&s, with 3pts from neckline to top. So 3pts down from right shoulder gives 1113.5 - so two things coinciding in that area.
- Messages
- 2,325
- Likes
- 17
V tops are very rare, so at some stage she has to attempt 1118 again. Currently going sideways at 1115 to 1116, so as there was not a big drop from 1118, then she's just building up to her next attempt at 1118.
So far there is clear air around the double bottom at 1114.25, and resistance at 1116.5.
So far there is clear air around the double bottom at 1114.25, and resistance at 1116.5.
- Messages
- 2,325
- Likes
- 17
I don't use bull/bear flags - only the patterns within them.
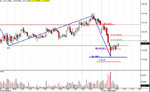
So what you call the bull flag, on the 5 min chart, ended with an Adam & Eve Bottom (a description coined by Alan Farley), and that is what I'm looking out for, not the overall flag.
So what you call the bull flag, on the 5 min chart, ended with an Adam & Eve Bottom (a description coined by Alan Farley), and that is what I'm looking out for, not the overall flag.
rossored
Senior member
- Messages
- 2,103
- Likes
- 56
This would be the pattern you are referring to, Skim?
http://tradingday.com/c/tatuto/adameveadam.html
http://tradingday.com/c/tatuto/adameveadam.html
china white
Established member
- Messages
- 979
- Likes
- 12
qaza,
quote: ""Bart" would be better" - lol, cheers mate 🙂 1 thing tho, bart as in Bartholomew or as in Baronet? 🙂
quote: ""Bart" would be better" - lol, cheers mate 🙂 1 thing tho, bart as in Bartholomew or as in Baronet? 🙂
- Messages
- 2,325
- Likes
- 17
rossored:
Yes, that's the fellow! It's just a type of double bottom - the first part is a quick down and up, and then the next bottom is a gradual slide down. Don't see them very often on ES.
Yes, that's the fellow! It's just a type of double bottom - the first part is a quick down and up, and then the next bottom is a gradual slide down. Don't see them very often on ES.
neil
Legendary member
- Messages
- 5,169
- Likes
- 754
£100 to £1500
Hate to be a purist but could we keep to the subject of "No Indicators" rather than include matter that should be posted on another thread?
This thread, "No Indicators" is one of the best since it relates to trading ideas and is devoid of the usual, "Show me how to get rich quick without any effort on my part," type of posts.
Well done Ford, Rossored and Skim et al.
- Messages
- 2,325
- Likes
- 17
Reddragon:
At that time I must have had about two years of intraday trading experience. But as I've shown, it's the ability to compound as well as make a few points per day consistently, which is the clue.
At that time I was trading just patterns (pennants and flags on the 1 min chart, using volume to get in front of the SB companies' spread/bias) and using targets to exit my trades. Using a target number also helped me get out with the spread/bias in my favour as I was not waiting for the market to turn before I exited.
The market at that time had lots of nice easy to see pennants and flags on the 1 min chart, so it wasn't difficult to make money. But then both the SB company's bias changed and spread widened, and the market itself changed. So it taught me to be flexible on the patterns I traded.
The secret, I believe, is training your eye to know a pattern, and to know when it is of a good quality. If you know just one pattern inside out, know what it looks like, when and where it forms, and can sit on your hands until it forms, then you can easily make more than the 10 points a day on the Dow I illustrated. A double bottom, for instance, should net you 50 or more points, as long as you are able to stomach a pullback!
I do believe that experience makes you more able to sit on your hands - and the only way to realise this is by being impatient and jumping in all over the place 'just to be in the market'. Your results will soon show you how foolhardy this approach is.
So it's reasonably easy to get good trading results, as long as you have the discipline to study one or two patterns, and wait for the quality ones to appear.
Bigbusiness
Experienced member
- Messages
- 1,408
- Likes
- 23
neil
Legendary member
- Messages
- 5,169
- Likes
- 754
oatman said:Well........would you Adam and Eve it?
ps. is that allowed? :cheesy:
Oatman - you are merry wude 😀
Now where was I - ah yes:
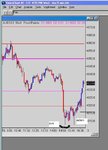
On a 5min chart see how prices react at Supp/Rest.
( Consolidation) levels over three days.
Oops - apologies for the 34 ema - it sneaked past me Skim, honest !
Attachments
Similar threads
- Replies
- 1
- Views
- 5K
- Replies
- 0
- Views
- 2K
- Replies
- 412
- Views
- 94K