You are using an out of date browser. It may not display this or other websites correctly.
You should upgrade or use an alternative browser.
You should upgrade or use an alternative browser.
'No indicators' revisited
- Thread starter ford
- Start date
- Watchers 53
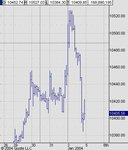
2468steve I have 10462 as the high on 31/12 if thats any help.
I find bigcharts to be OK at the end of the day but if you look at their intraday chart the day after, prior to the open of the following day, you get revised figures based on individual hi's/lo's - it can be confusing and threw me when I first started using them.
HTH
I find bigcharts to be OK at the end of the day but if you look at their intraday chart the day after, prior to the open of the following day, you get revised figures based on individual hi's/lo's - it can be confusing and threw me when I first started using them.
HTH
- Messages
- 2,325
- Likes
- 17
2468steve / oatman:
Yes, it was a key reversal (when you said it, I did remember that that is its official terminology).
If anyone else wants to know more about Key Reversals:
http://www.incrediblecharts.com/technical/key_reversal.htm
Yes, it was a key reversal (when you said it, I did remember that that is its official terminology).
If anyone else wants to know more about Key Reversals:
http://www.incrediblecharts.com/technical/key_reversal.htm
Skim,
Monday should be interesting....under normal cicumstances the key reversal would be a sell signal..i have doubts though,with new money coming in for the New Year we may see more upside.although yesterdays high would need to be taken out .Makes the trade pretty simple tho',follow the break of the high at 10527 or the low at 10384.
IMO we may see an inside day,contained by yesterdays high/low,and then a break down Tuesday.....??
cheers
- Messages
- 2,325
- Likes
- 17
- Messages
- 2,325
- Likes
- 17
steve:
At the moment there's a lot of fresh air around that top, so we might get a pullback first.
The price formation yesterday also looks a bit like a head, with the left shoulder formed over 30 & 31st Dec. If so, the 'neckline' it has just bounced off is lower than the previous neckline, which is often bearish.
Actually, waiting for the gap & trap moves is often a way of picking the tops and bottoms of a trend - and one way of beating the SB companies when trading EOD (end of day). But it takes practice in knowing what is a gap & trap, and what isn't.
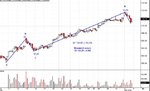
So playing EOD you would be short, with the stop just above the Jan 2 high, and follow the trend down by moving the stops down along the tops of the bars. And then reverse to long on the significant break of the previous day's high bar.
Remember too that prices often retrace 50% of their prior major move, so in this instance the Dow may retrace to around 10460. This would also coincide with the formation of a right shoulder, and it's nice when two or more things coincide. 😀
At the moment there's a lot of fresh air around that top, so we might get a pullback first.
The price formation yesterday also looks a bit like a head, with the left shoulder formed over 30 & 31st Dec. If so, the 'neckline' it has just bounced off is lower than the previous neckline, which is often bearish.
Actually, waiting for the gap & trap moves is often a way of picking the tops and bottoms of a trend - and one way of beating the SB companies when trading EOD (end of day). But it takes practice in knowing what is a gap & trap, and what isn't.
So playing EOD you would be short, with the stop just above the Jan 2 high, and follow the trend down by moving the stops down along the tops of the bars. And then reverse to long on the significant break of the previous day's high bar.
Remember too that prices often retrace 50% of their prior major move, so in this instance the Dow may retrace to around 10460. This would also coincide with the formation of a right shoulder, and it's nice when two or more things coincide. 😀
- Messages
- 2,325
- Likes
- 17
steve:
Looks like our posts crossed! Great minds think alike, eh? LOL
Looks like our posts crossed! Great minds think alike, eh? LOL
Skim,
thanks,you just confirmed my thoughts.I've had some success with these reversals,especially on news releases pre open etc...
The last one on the capture of Saddam being the exception...we got a "pop and drop" on the Monday...but the Tuesday onwards saw buying strength....
How would you identify the validity of the gap& trap??
cheers
- Messages
- 2,325
- Likes
- 17
I too got caught on the Saddam capture one - LOL. The following day didn't break below the low of the Saddam day, and closed at the top of the bar, which is a bullish reversal.
Looking back, we may find that the Saddam bar was in fact a left shoulder. We've not seen such a significant reversal since that day. So something to watch out for in the future - a bounce (neckline) coinciding with the low of the Saddam capture day.
Just from observation (no back testing of course - can't be bothered with all that messing around that you boys love!) the gap & trap moves are quite consistent when they appear at the tops and bottoms of trends/pullbacks. If you always obey the trend, and assume the pullback will be a short trade, then it works wonders.
But we've been in a trending situation since the first shot was fired in the Iraqi war, so it's been easy peasy trading. Whipsaw stuff sorts the women out from the girls! And that's a whole different ballgame.
- Messages
- 2,325
- Likes
- 17
LOL - didn't know about that being one of CM's magic numbers.
Just goes to show that there are many ways to skin a cat - those who do so in broad daylight, and those of us on the dark side. :cheesy:
I do notice that CM is becoming a frequent visitor here, so perhaps he's beginning to feel the pull of the dark side! LOL
Just goes to show that there are many ways to skin a cat - those who do so in broad daylight, and those of us on the dark side. :cheesy:
I do notice that CM is becoming a frequent visitor here, so perhaps he's beginning to feel the pull of the dark side! LOL
Hmm, this dark side does look quite interesting - whaddaya reckon CM? Looks like I may be following you into it 🙂
At the very least, its probably more relaxing to trade the longer time frames - kinda comes in handy when one is in a full timejob.
Thx or all your input / info skim - this site is full of gems - if one has the patience and dedication to read thru it all 🙂
BB - thx for the link to the free charts site - my options on charting are limited 'cos most don't work thru our corporate firewall - this one does.
china white
Established member
- Messages
- 979
- Likes
- 12
well well 🙂 after all we r after the same signs from the mrkt demonstrated in different fashions 🙂 btw some of the dark-siders 🙂 r following Tick quite closely - which is what I do like a hawk in my twilight zone - LOL
The dark side has many unknowns-... Having spent all that time on the light side, it would be a major leap, so for now, I will look at it from a cross-correlation point of view. That and the fact that my old brain is less receptive to new ideas. :cheesy:
There is undoubted merit in simplicity and purity.
There is undoubted merit in simplicity and purity.
china white
Established member
- Messages
- 979
- Likes
- 12
Alr8 lads/lasses - cards on the table 🙂 apart from my professional career - which (unlike what we do here) is a "career" 1st, and only then trading, so its a different game - there were 3 ppl who really influenced me and helped me develop my trading system, which if it was a lass, I'd be taking down the aisle now 🙂. We all know one of those three - it is CM whoz truly the King of Divergencies and from whom I learnt the "crem de la creme" of how to apply them. The 2nd one is a chap some of u may hv heard of - it is voodoo who used to be on pitstock, not any more sadly, he's still posting on his brilliant website http://voodootrader.com/ta.htm - this lad is steel sharp in Fib analysis, measured moves and tick Fib timing.
Now let me tell about the 3rd one whoz experience actually shaped my system as it is.
On my last trip to Buenos Aires I met a real fossil (90+ yrs old) who hap'd to know my granddad when they both had to run from Italy in 1944. This old man was a paper boy at the Italian Stock Exchange for a long time, he was there when "Communisti" took over Fiat factories in 1921, he was there on the day when Victor Emmanuil III ordered the troops to let "Fascisti" into Rome in 1922. He still vividly remembers how ppl traded on the exchange then - 1st hour pivots + what u lot call dark side here + marking with a chalk on a blackboard how many issues tick up vs. how many tick down and comparing the dynamics of this difference vs. the dynamics of the exchange. Sounds familiar? Of coz noone called it a tick divergence then.... 🙂
Voila 🙂 i hope this explaind the essence of my "twilight zone" 🙂 and my keen interest in the dark side - even tho i am not a voting member on the dark side 🙂 - more like Russia in NATO - lol!
- Messages
- 2,325
- Likes
- 17
That's interesting Mr White. I too was taught by an old fossil - and the hardest thing I've found is trying to forget all the new fangled stuff that I've learnt via trading courses and books.
The old fossils learnt their craft the long way - by watching and learning day in, day out, over years. The young whippersnappers today want to know a strategy one day, trade it the next, and retire to a sun-kissed beach the following day on the proceeds of their one day's trading.
It always reminds me of the classic hare and tortoise race - the dark side is the tortoise, dismissed by the majority. Perhaps I should change my avatar to a tortoise! LOL
china white
Established member
- Messages
- 979
- Likes
- 12
what shall i change my cat-tich avatar to then, skim? 🙂
Similar threads
- Replies
- 1
- Views
- 5K
- Replies
- 0
- Views
- 2K
- Replies
- 412
- Views
- 95K