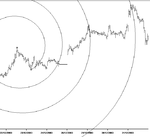
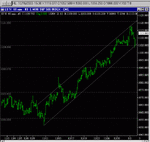
Hmmm. Sorry, but I see Fib numbers, Gann geometry etc as nothing but hocus pocus. In the odd occasion that they do work, I'm convinced it's simply because the levels become self-fulfilling prophesies - like the 50% retracement.
Markets stop rising when the buyers stop buying for what ever reason. This is why the closes as bar formation in relation to eachother as Skim rightly pointed out is SO important. This is the only way (that I'm aware of) that can tell you the real underlying activity and psychology that is unfolding. When I was at liffe, I never - NOT ONCE herd ANYONE say 'Oi lads, were at the 61.32455634 level, better start buying!' What we often did do though is take the market a few ticks past the 50% level so as to excite paper a bit and flush out a bit more action. We knew paper had price orders at these levels.
Greek philosophers and mathematicians saw Fib as significant because it illustrated balance in nature, the arts, and even the human body. It was the epitome of balance-the perfect shape … the most pleasing vision. THIS is why I believe some people like Fib so much - because it gives a nice aesthetic way of explaining turns, without having to lern about market dynamics
The only indicator worth anything imho is Bollinger Bands - or any other vol indicator.
Understanding what is happening on a price chart is the easier aspect of trading. Acting on that information and managing your trade, risk and self correctly are the harder parts.
...but if spirals make you money then good for you!


