Message For Ftse Traders......

there is an interesting article on prudentbear.com by martin hutchison,whom i hold in good regard.
he has done an analysis on the obama stimulus package.it does not make pleasant reading
 
closed position @ 4170 ...massive 70 point profit!!

I also opened short S&P @847 whilst in hospital as major major resistance @ 850!!

closed @ 834.......just now!!

Wow............I have just come back home people and i am absolutely shocked..........

When i opened short I never expected this, flabbergasted!!

This has messed up all my analysis and i will have to spend a few hours again to analyse!! darn........

anybody have the answer for the fall, I'm looking at CNBC/Bloomberg..........!! cant find a reason......

This is all I could find on Bloomberg Bloomberg.com: Worldwide

So many analysists where talking about an S&P rally to 936 ish, retesting the highs of 6 Jan, and I was bullish today.

Now I have no idea! Over to you Mr. Wallstreet?

Ollie
 
Oh what the hell , one more post using my profit"!!

long FTSE 4162............stop loss 4130!!

bounce off 200 day EMA.........

i will explain rest later!!

only trading 1 contract as risky!!
 
disney and kraft according to bloomberg.this is my chart.s500 had already broken the uptrend line
 

Attachments

  • US SPX500 (-).png
    US SPX500 (-).png
    13.1 KB · Views: 118
a better chart.shows the price action.noy a great breakout trend.very few long columns of "x" s.most are followed by long retrace column.price still in an uptrend.support came in at the trendline
notice,how,the initial break is small.followed immediately by a consolidation.then a decent breakout,followed by a longish /wide consolidation
decent trends have long thrust columns with minor retraces.in p/f language
 

Attachments

  • corrected.png
    corrected.png
    14.9 KB · Views: 109
a better chart.shows the price action.noy a great breakout trend.very few long columns of "x" s.most are followed by long retrace column.price still in an uptrend.support came in at the trendline
notice,how,the initial break is small.followed immediately by a consolidation.then a decent breakout,followed by a longish /wide consolidation
decent trends have long thrust columns with minor retraces.in p/f language

As the FTSE retraced 50% of the last 2 days up move, down to 4152 ish, is it safe to say this is a weak trend for the FTSE? I.e. the greater the retracement, the weaker the move?

Also, from a Bar chart, can we glean anything from the relative angles of the up/down trends? I note that the last 2 days up move on the FTSE has a shallower angle than the uptrend of 23rd to 28th Jan.

Ollie
usually,but more difficult to see on bar charts.easier to see on candles
in my mind.good trends have long b/o columns,shallow retrace.in candles ,these translate to long bodies,small wicks.trendline in p/f ,especially 3 box reversals are always drawn at 45 degrees.even on candles,good trends are at 45 degrees
so in p/f,we are looking at price action and not change in price over time.so,looking at the chart,each column is showing in itself s/r aeas,aswell as change in price.so,you really can get more information from the chart.
hope this explains
 
this is actuallly the right chart.price has breached the uptrend line.it is all to do with the igmarkets charting screenshot application.sometimes it does not print what i am actually seeing
 

Attachments

  • 43.png
    43.png
    16.1 KB · Views: 121
Although monetary wise I have had a pretty gash today, it has really cleared my mind and I have a lot more focused view on what I am looking for to trade to achieve a high % of winners.

A question I do have though, the thing I lack is any sort of market information / reports of whatever. My trades are based solely on what I can see on the chart, and it would be good to have an idea of what is in store, ie. interest rates tomorrow but the smaller reports daily. Anyone have anything good for this?

And more to the point, thoughts regarding the interest rate? I hope they dont cut it again.. can't see it helping and would further weaken the markets (imo)

This is the calendar I use - Forex News | Forex Trading News | Currency Trading News

KJ
 
I'm back from my little vacation......

watching the scouser war and the Englands cricket adventure in the carribean

Everton v Liverpool - FA cup 15 mins left and it could go either, long or short ...haha!!

England not doing well as usual 200 - 5, they will get hammered in the Ashes this summer!!
 
this is the best explanation you will find anywhere for today's price action, simply brilliant......

"well, here we go... I will admit to being a little surprised by today's price action, although thinking about it logically, I should perhaps not be. Once again, it is these corrective waves which are often so difficult to read. You will remember during December when we were in the wave 4 of this bear market, I was finding the volatility difficult back then. The point is that corrective waves are more difficult to read because they can take on so many different forms within the Elliott guidelines. This does not mean that the guidelines are woolly, it means that they do allow for different possibilities. However, one thing which is certain about markets is that one of their functions is to maximise trade - which is why, among other things, gaps usually get filled. The other facet about maximising trade is that the markets will always try to knock out our stops - because, once again, that maximises trade.

So today what have we seen? I think we have seen a spike akin to a bear squeeze which has knocked out a lot of stops, and in doing so has caused the market to rise even more sharply by triggering those buy orders. The point there is that once those buy orders have been triggered, because they are stops, they will be closing trades, and therefore the market will fall back more sharply after they have been executed than it would had they been part of a more genuine bull run. Hence, we have seen the market come off very sharply, with the Dow also coming back below 8,000 - with all the psychological factors that that entails.

A few days ago now I had mentioned the possibility of a bear squeeze in my emails, but then I thought the risk of that had diminished a little. It was only in the face of yesterday's and today's strong rises that I felt had to take a closer look at any alternative possibility that could exist. And the only one I came up with was that the corrective wave (correcting the January fall) might not be complete.

The problem now is one of sentiment - and sentiment is affected greatly when the Dow nudges 8,000, after all, we have all seen the repeated bounces off that level. The fear factor is there, and basically the fear is that if the Dow fails to hold 8,000, then how far does it go?

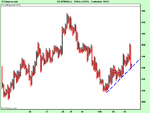
My own belief, as you know, is that we will see it well below 8,000, and we will also see the FTSE head down toward 3,500 in the next month or so.

Whether we have seen the top of the correction here or not is a point for debate now. But the two possibilities are there: if we have seen the top, then I think that the decline could be swift, but if we haven't, then personally I will use what's left of any rise to add to my existing long term short position.

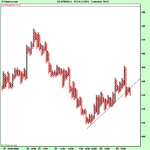
One other point in favour of continued downside is that the Dax is showing a very pronounced selling spike up to 4,550, retesting the levels it last saw at the peak on 28th January, which was the previous peak of this corrective wave..

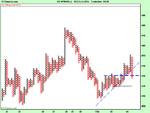
As I write this, the Dow is just closing around 7,960 and has been bouncing around 7,940 - 7,990 for the last 2 hours. Looking weak."

My good friend Sir William,
 
Oh what the hell , one more post using my profit"!!

long FTSE 4162............stop loss 4130!!

bounce off 200 day EMA.........

i will explain rest later!!

only trading 1 contract as risky!!

I had amended my stop loss to break even and it has been triggered......

Oh well looking forward to the morning to see a big Gap down on my Barclays short @ 97p?
 
In laymans terms it was a bear squeeze my friend..........

this paragraph will explain all.....

"I think we have seen a spike akin to a bear squeeze which has knocked out a lot of stops, and in doing so has caused the market to rise even more sharply by triggering those buy orders. The point there is that once those buy orders have been triggered, because they are stops, they will be closing trades, and therefore the market will fall back more sharply after they have been executed than it would had they been part of a more genuine bull run."

do you understand it?

your a simple person, your charts are quiet in depth and intricate my friend!!
 
Top