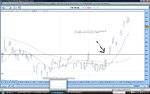
There was, mate, but neither you nor I saw it, probably because it went sideways for such a long time that we ignored the fact that a reversal was building up.
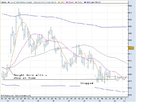
At 1330 I could not see what to do and decided that SP500 was a better trade for me, being at work, etc. so I bought the Daily Future. Like the 10,000 men, they marched all the way up the hill (galloped, actually) then marched all the way down. Stopping me out at a loss around 1900. I was browned off at that one especially as the Footsie did not behave quite like that. I would have saved something, at least, with Footsie.
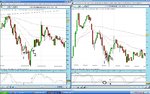
My system with averages is not good with sideways movements. Anyone got an alternative to
1) Identify them quickly and
2) stay out of them until a breakout is due?
Split