well, i tend to wait for a break of a trendline instead of entering from top/bottom of the move...for me changing the direction is related to a trendline break...
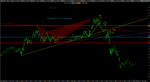
OK WITH REFERENCE TO TRENDLINE. THIS IS HOW I SEE THINGS SOMETIMES
3 YELLOW TRENDLINES. these show successive relaxing of bull pressure, ie i see a dynamic trendiness as a measure of power that is consistent in gradient over time, ie it will describe the current trend for a while. when it breaks that means something, possibly the most concrete aspect of t.a
here we see eu breaking interim, interim 2 and the two mains. RED STARS SHOW POSSIBLE ENTRIES working off these more " local" /interim / recent levels. purple star im not sure about the entry there.
the white dashed lone is the AC trendline from the harmonic shape. ut seems relevant but there are several possible lines in this are so who really knows. noticde the confluence of 3 separate fibonnaci measurements at the turning point d, these are the xa, extension, the abcd expansion and the bc extension. to me there has to be something in this shape and the strong reactin from this point but many would disagree.
so, with refenrece to trendlines, are you perhaps entering too late for a scalper?!?