Index King In Da' House !

Wideboy,

You could eliminate the increasing gap by normalising the data about zero. For instance, you could subtract a longer-term moving average of the difference from the short-term difference. This technique and similar are often used for inputs to neural nets which work best with values that oscillate around zero.

Paul
 
FOWKESP

Excellent piece of info.


It say's account size Long $861 / Short $770.

How would the resulting figures be if Spreadbetting at £1 per point ie. £1 on the DOW and £1 on the FTSE?
 
Guys, I will post my spreadsheet here in a few hours once I get home (would rather not do it from work), and as was mentioned everyone can do what they want with it. FYI the biggest gain in the past 3yrs has been 800pts, the biggest loss 500 (and a couple at the 400 mark too).
 
Darren,

The results are based on $1 per point of the DOW-FTSE difference. If you actually traded it, you would have 2 positions open, 1 short and 1 long so you would need the margin to support those. The wins would be as per the report. Just change the figures to GBP (TS only uses USD).

I would take those account size values with extra-large, double pinches of salt. They are trying to tell you the account size you need to see out the worst drawdown (long and short) without busting your account. They do not include any margin required in that particular report. Remember, your worst drawdown is always yet to come :D so at least double those account size values and preferably make them even bigger. Even then you can't be sure with back-tested systems like these.

It's easy to generate systems like this with Tradestation, but I would have little confidence in this system until 1) it had been double-checked manually and 2) had proved itself for 30-40 trades in real time.

Paul
 
dont think this is of help, but here it is anyway.

13 day moving average of Dow/Ftse difference.

(bit out of date , but you get the picture)
 

Attachments

  • diff.gif
    diff.gif
    3.1 KB · Views: 840
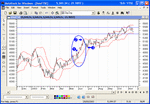
I'm not sure if this helps or not but I attach a chart of the difference with a Bollinger imposed.

I have no idea how IK worked his system but I wanted to address the problem of stop losses when the DOW is moving against FTSE.

In the period May/June this year I would guess that Hugo's system gave a "Sell DOW" on 30/05 (Arrow 1) when the difference was 4803. It then continued up, clinging to the Bollinger until it reached a value of 5166 on 16/06 (arrow 2) indicating a -363 position.

I would imagine that the first time in this trade when his system stopped and reversed would be 27/06 (Arrow 3) at which time the loss on the trade would be -118 points, ignoring spread.

So setting a stop at say, 150 points would have exited at the close on 11/06 for a loss of -170.

This is one of the worst movements in the past few years and I'm not sure how a stop loss system could be constructed to do better than the system shows already.
 

Attachments

  • djiftse1811.gif
    djiftse1811.gif
    28.5 KB · Views: 796
Hi Peter

yes i see what you mean ,maybe the system works best with no stops at all,but will be risky at times . :rolleyes:
 
OK guys, my records show the formula looking good on all past days until today.

FT close: 4354
Therefore: 9809 - 4377 + 4354 = 9786

IK has got the the reversal as 9763

Any idea's.. or is IK fooling around with us..:)

Cheers Snip
 
He could be fooling around with us. Some bright spark put todays level in his guestbook before it appeared on the website!

Perhaps he wants it to end early so he can get on with his other job.
 
I rekon he's just fooloing around.

The guy told us a lot of lies....and can't come here to defend himself. Just another con artist.
 
This is a chart of the FTSE v Dow from June 2000 until now.

It shows that the FTSE isn't keeping pace with the Dow.
 

Attachments

  • ftsedow.gif
    ftsedow.gif
    8.9 KB · Views: 737
Ok guys, as promised here is my spreadsheet. If anyone has any comments or any ammendments to make it better, I'd be interested to hear them. Going forwards, you should just be able to input the index closing values and drag the formulas down to get the right numbers and strategy. The manual aspect is the profit number (I couldn't work out a way to do it using formulas so I had to do it trade by trade).
 

Attachments

  • dowftse trading.xls
    264 KB · Views: 293
BigB

I think IK's formula accounts for the dow and FT spreading either way, as long as they do not do it abruptly. The 7 day lagging values are always catching up, a bit like a MA does.

Cheers Snip
 
I think you are right Snip.

Thanks for the spread sheet Gecko. I wonder if there is a bit more to this than we know already?

If you can trade at 25pts better than the signals, it would make a big difference. Most of the trades I have looked at swing out before turning in the right direction.
 
BB
it may be worth throwing moving averages at it, to find one that turns when a tip is announced.
probably the same duration each time and probably an ema ?

they often suffer from pull backs before the new trend bites.
 
yup, still in the dow/ftse - down 100 odd - small stake tho 'cos was just trying the sys out.

Thx for the ss, gecko - looks like this thread could refine IK's strategy for the better ......
 
Top