You are using an out of date browser. It may not display this or other websites correctly.
You should upgrade or use an alternative browser.
You should upgrade or use an alternative browser.
hornblower
Established member
- Messages
- 884
- Likes
- 29
long euro/jap 164.26 doing ok
long euro/usd 14038 not doing so good
long euro/usd 14038 not doing so good
TheBramble
Legendary member
- Messages
- 8,394
- Likes
- 1,171
Inner channel just 9 pips wide at 332 to 341.
Outer channel 300 to 373.
300 will obviously present some support, but the very narrow inner bands are also proving difficult to convincingly break. They’re not quite containing the action. Which is giving plenty of indications of support and then breaking through and showing as resistance and then pushing through and repeating the cycle. Too choppy for me to trade, but thankfully too narrow a range to be attractive to trade anyway.
I’ll be looking to play action off the outer levels only, either as a new range (Support & Resistance) or as confirmed breakouts from that range. It’ll need a little more momentum as well to convince me. Even the oscillators are range bound, which is good, because it’ll need something ‘obvious’ to be happening there too for me to venture outside.
Great day for scalpers.
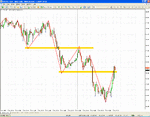
Sup/Res for EURJPY. possible short?
you are probably right, not conclusive yet IMHO
want to see the 4 hr close prior to a trade
Attachments
TheBramble
Legendary member
- Messages
- 8,394
- Likes
- 1,171
You know what I mean....They're not even touching 'normal' OB/OS levels.Even the oscillators are range bound...
hornblower
Established member
- Messages
- 884
- Likes
- 29
euro/jap close for + 40
euro/usd closed for +7
run out of momentum
euro/usd closed for +7
run out of momentum
well, after bad trade management at 3 pm, (long from 164.33, stopped for BE), i am in again long from 80 on a smallish bull flag. i am tired, have to put my kid to bed, and have again (probably) mistakenly moved my stop to breakeven. I am targetting 70 pips. will post my setups later.
trendie
Legendary member
- Messages
- 6,875
- Likes
- 1,433
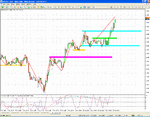
having another go at sup/res. ( keep thinking of twig-birds!! 🙂 )
blue-lines = todays range. (although the green line could be a truer reflection of the upper range, as its closer to todays open, and upper blue-line is only there to account for the spike early in the morning)
yellow-line (today) = support, as price seemed to "rest" there early in asian session.
pink-purple line: this the height that teh US-session went to, before a drfit upwards. I am making an assumption that the US wont want this breached today without a change in sentiment. any closes below this line and failure to rebound may mean change in sentiment and some downward drift.
if you do this sup/res often enough, there is a sense of "reading" the market rather than reading an indicator, and being a truer reflection, but its when the sup/res fails and I cant explain it, is when the problems start, and I lose confidence.
(hope you dont mind me rambling on this thread about my attempts to use sup/res)
Attachments
JillyB
Established member
- Messages
- 791
- Likes
- 38
having another go at sup/res. ( keep thinking of twig-birds!! 🙂 )
blue-lines = todays range. (although the green line could be a truer reflection of the upper range, as its closer to todays open, and upper blue-line is only there to account for the spike early in the morning)
yellow-line (today) = support, as price seemed to "rest" there early in asian session.
pink-purple line: this the height that teh US-session went to, before a drfit upwards. I am making an assumption that the US wont want this breached today without a change in sentiment. any closes below this line and failure to rebound may mean change in sentiment and some downward drift.
if you do this sup/res often enough, there is a sense of "reading" the market rather than reading an indicator, and being a truer reflection, but its when the sup/res fails and I cant explain it, is when the problems start, and I lose confidence.
(hope you dont mind me rambling on this thread about my attempts to use sup/res)
Looks good to me. It's the same levels that I have noted on my chart.
Orders board notes buy stops at around 2.0450 and more at 2.0500. So perhaps we could see a turn at around this level.
trendie
Legendary member
- Messages
- 6,875
- Likes
- 1,433
Alternatively, you could map the zones from the larger timeframe(s) & cascade them down onto your smaller template frames? By casting your s&r net farther out, you might catch the flows on your smaller timeframe charts from those who have a slightly heavier interest in one or two of these major swing levels?
There’s no right or wrong, merely which preference & timeframe execution strat, suits your aims I guess.
A good percentage of the previous lines of conflict from prior trading quarters will usually hold good on return trips from Bull-Bear rejection levels.
It can make for an interesting fist-fight when one or two of the far reaching s&r zones come into focus on the smaller timeframes.
I think we’re all aware the more obvious swing extremes harbour sensitive stops of one persuasion or another. Always good for increased volatility when they converge.
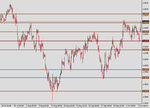
I’ve borrowed this 240m chart from my twin to highlight one or two likely levels during the 2nd half of this year. The recent hike up off the 1.9900-2.000 area certainly carries more significance to 2nd half behaviour, & will probably reflect similar traits on any journey back?
Well, we hope so anyway 🙂
Attachments
trendie
Legendary member
- Messages
- 6,875
- Likes
- 1,433
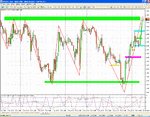
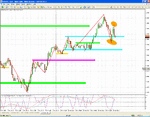
this is what does my head in.
since major resistance appears to be respected, (the upper green line), does this mean we should consider the market to now be in a down-phase? (problem with that we are boxing ourselves into the belief that the market is forever constrained between two areas.)
I dont know if:
a: the upper orange ellipse is a pullback to resistance on its way down. (DOWN)
(have started to notice these pullbacks on the morning opening range.)
b: the lower orange ellipse is a higher-high preparing for a break of resistance. (UP)
interestingly, the lower green line seems to be the point that the market fell back to before rebounding. so maybe this was the true morning range.
I shall stick to my earlier belief that the yesterdays US close is strong support.
Attachments
dunno trendie, IMO i guess it will end breaking north with strength, but then again who knows.
in the meantime, scalp it till you get tired 😛 .
i'm out already 35 on the way down on the HS, 30 on the way up from support, and now keeping a stop at BE on the current short. if it goes down, good, if it stops me, i dont care. day over, and im going out and pick my kid from school. 😛
in the meantime, scalp it till you get tired 😛 .
i'm out already 35 on the way down on the HS, 30 on the way up from support, and now keeping a stop at BE on the current short. if it goes down, good, if it stops me, i dont care. day over, and im going out and pick my kid from school. 😛
actually, trendie, you just got me thinking.
look at this channel using 4 hr closes. kind of makes me wonder that the first close out of that range gives direction. until then, i guess any move out of the range are false breakouts.
I really dont know. i am only observing recently the importance of closes for direction, and cant get a conclusion. 😱
Attachments
TheBramble
Legendary member
- Messages
- 8,394
- Likes
- 1,171
Thursday - Oct 11th 2007
Action is close to London open high and we have a potential Bearish Hidden Divergence approaching the 0423 level.
Action is close to London open high and we have a potential Bearish Hidden Divergence approaching the 0423 level.
trendie
Legendary member
- Messages
- 6,875
- Likes
- 1,433
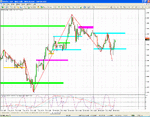
new mornings opening range. (light-blue lines)
similar to yesterdays range.
interestingly, the price this morning dipped to Tuesdays US-high, which I thought might be strong support.
the new magenta line drawn on yesterdays action, is US-session high of yesterday.
if we are moving down, I wonder if this will form resistance for next couple of days.
taking a step back, and looking at the two morning opening ranges and yesterdays high, if you squint, with the sunlight hitting the screen at the correct angle, it looks like a head and shoulders pattern.

