FX trading Oct 22-26

made a few points on euro/jap, and gbp/jap , on the way up
I have a short on s and p
and a short on the euro / usd, because i feel its running out of steam
 
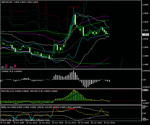
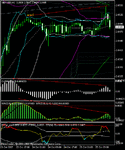
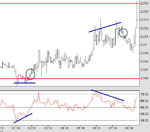
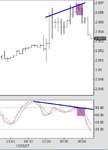
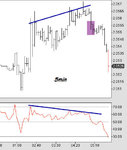
The screenshot shows the regular sequential bearish divergence in the 30min oscillators gbpusd at that high of today. Price retracing further back into intraday congestion zone now with U.s data due in 2mins.
 

Attachments

  • 30min.gif
    30min.gif
    25.7 KB · Views: 149
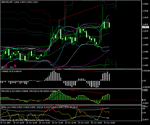
The initial knee-jerk sell $ in gbpusd on that weak data follows thru for a new high above that 35 area resistance at that next level 0550-60, before a fall back. Nice set-up there for the short. Minor pivot Dly FR4 and the 138.2 extension of yesterdays range in area too.

(Reversal Extreme with confirming 5min Reversal A sequential confirm.) screenshots below.

The new 5/15/30min potential RBS zone becomes 0531- 0490 now.

[There was a fair 1m Reversal and 5min Reentry confirm set-up just on the break of that data at about 0498ask entry, but I didn't take it due to data imminent, but with forecasts with it, maybe should have been more aggressive. Oh well.
 

Attachments

  • 1342pm 1min.gif
    1342pm 1min.gif
    17.2 KB · Views: 138
  • 1342pm 5min confirm.gif
    1342pm 5min confirm.gif
    19.1 KB · Views: 142
Last edited:
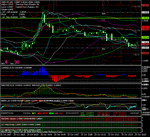
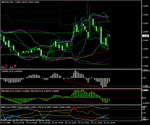
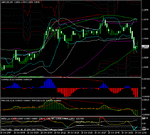
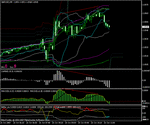
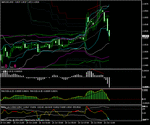
The screenshot below better shows the 1min (trigger) Reversal Extreme set-up at that 0550-60 resistance. (It is the actual 1min chart, the screenshot above is the 5min chart with the time changed to 1min) This screenshot better shows the extreme readings on the oscillators and the minor pivots, although some might say it looks a little crowded, but I'm used to it. ...have it on a big screen, lol.
 

Attachments

  • 1342pm 1min.gif
    1342pm 1min.gif
    26.4 KB · Views: 144
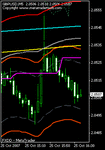
The screenshot below is the 'small' chart i run alongside my main chart. It shows the 5min situation at the time of that 0550-60 Reversal mentioined above. As you will see there had been a strong breech of the donchian channel (pink) and the first fib tunnel extreme (red) and the fib channels had come across horizointally to indicate resistance (yellow and aqua.) All in all good technical confirmers of the 5min Reversal A sequential set-up on main chart referred to above, particularly as this intermediate chart confirming set-up had the less strong regular sequential divergence (seq) in the oscillators as opposed to first preference regular immediate divergence. There was however bearish divergence of varying strengths on 30 and 1hr at same time.
 

Attachments

  • 5min small.gif
    5min small.gif
    5.7 KB · Views: 125
I’m not trading today, but that ‘confirmed’ double re-test of 500 support followed by a subsequent dummy through it will have taken its toll. I see bodies strewn everywhere. 😆 Looks like a well ordered advance though.

Don’t have access to my screens at the moment, but looking on Yahoo, 0547 is still up for the taking, that's the next decision point.
 
Im done trading for today.

Review of 'stuff' above price atm: 0535 the prev hi of the wk/mth , 0550/60 (0554 current Daily/weekly/monthly Hi) offers and an option barrier still untouched at 0560 reported. 0562 is hi of 26/7 and a channel top from 28/9.

0563-71 Dly r1 area
0576 is Wkly H3 cam (break or bounce pivot...break favours targets H4 and H5.)
0587 is highs of 20/7
0600 is Wkly R1 pivot 0602 the hi of 23/7

0621 25/7 hi
0562 150% ext of yesterdays range
0625 Dly R3 pivot area
0626 the current 1% ma envelope top

0634 Wkly M4 pivot

0652 Hi of 24/7 and current Yrly Hi

0680 Wkly R2 and Mthly R1 pivot.

Mni latest: offers remain at 0550/60 area with 0575/85 next potential area of offers above that...0575 rumoured too to be holding an option barrier.
 
Last edited:
The screenshot was the 1hr bearish divergence at that 0550/60 resistance area referred to in a post above.

With clear confirming set-ups up to 1hr it can indicate a deeper pullback/reversal. (ie it was a set-up on bthe chart above my own longer time frame of 30min.)

(Reversal A(ii) seq)
 

Attachments

  • 1342pm reversal 1hr.gif
    1342pm reversal 1hr.gif
    16 KB · Views: 135
Another example of time frames confirming each other, just gone in cable. (was away from dek as had finished for day, so didn't trade it., but would have done if had been around.)

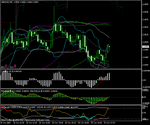
Price had pulled back into the last but one 5min RBS zone which was also the last 15/30min zone without a spike. 0495-0471 and was therefore back in that earlier intraday congestion area.


With the daily pivot at 0476 area, You'll see the 1min bullish divergence set-up confirmed by the 5min bullish divergence based set-up and the 15min hidden divergence based set-up in this RBS zone.

(Reversal A(ii) seq with 5min Reversal type B and 15min Reentry type 1 confirm at RBS zone)

Will price make a new high on the day? I have no idea but the set-up has already shown 20pips and on an intraday 1min trigger thats a nice result. These set-ups of course work on any combination of time frames, mine is 1/5/30min as the trigger/intermediate/longer term time frames, with reference to the 15min as the 'next' that can fall bewteen your intermediate and longer time frame depending on your chosen time configuration.
 

Attachments

  • 15min.gif
    15min.gif
    19.6 KB · Views: 128
  • 5min.gif
    5min.gif
    20 KB · Views: 140
  • 1min.gif
    1min.gif
    21.6 KB · Views: 144
You got a pretty tight handle on your strategy there bb. Just goes to show what a thorough understanding & appreciation of your instrument(s) can achieve if you put the work in & it fits your trading style like a glove.

The divergence framework throws up regular opportunities on the pairs, & even something simple like an RSI can assist in weeding out prospective entries on the smaller timeframes at these reactionary s&r zones.

The 2.0460 level has signalled a couple of glaring home runs this month utilizing this assistor, as has the lower range floor at 2.0270.

For those seeking a minimal, uncomplicated addition to their arsenal, they could do a lot worse than to haul something like this up to help shine a light or two if they preferred to execute via the sub hourlies.

Like anything else, they’ll obviously work best if one possesses a decent understanding & appreciation of your preferred pairs behaviour etc, but I guess that’s a given whatever your method.

Common example today on the Cable, legging into early Frankfurt trade, & out prior to the 1st Stateside data print at 8.30 for a low stress +40.

There were a couple more set ups across the Yen crosses earlier also – but then these type of set ups trigger regularly across the trading week.
 

Attachments

  • oscdiverg.jpg
    oscdiverg.jpg
    47.9 KB · Views: 163
everything is looking on the high side , is there any more up side ??
or is it down from here ?
looking for shorts today
 
If you're talking real short-term (intradayish) then I guess sure, it'll ebb & flow according to the flavor of the day.

Mid-term, the fundamentals suggest otherwise don't they? They're now debating whether a 0.25% reduction will be sufficient, with some laying dollars down for a 0.5% slice. Whilst uncertainty remains, you can bet the conditions will get windy out there.

There's certainly no reason to have cashed out if you legged in long again earlier this week off the 2.0270/1.4150 supports that's for sure.

But I guess it depends a whole lot on how you play your bets (short or mid-term stance).

Then again, those who play both sets of triggers will be sitting pretty whatever happens.
 
Perhaps a rest, before cable goes back to attack 570 again.

A fall down to about 510-513, if that gives way, 480.

Onthe other hand, if it breaks 570 and stays, I`m long no matter what. COuld go up to 660 before reversing.

Does anyone know hte corelation between oil and cable ?

Thanks

CT.
 
just out of curiosity, how is JillyB doing with her "7-am pivot thingummy" that she described recently?
 
Ampro, agree with your comments re divergence etc..


Today: This 0575 area saw stoch readings to 4hr being in the extreme o/b 90+ area. Area is confirmed as holding an option barrier at 0480 (MNi) , further offers also liklely at 0600 (minor) and 0650/60, area of current yearly hi.

Tight asian/overnight range of 0506-0529 broken to the upside meeting resistance first time round at that 0555/65 area before the current highs.

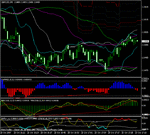
The screenshots show the divergence/band deviation pullback/reversal set-ups on 1 and 5min charts at that 0575/85 resistance area which also houses the Wkly H3 cam (break or bounce) pivot, and 26/7 hi .

(Reversal A(ii) seq with 5min Reversal C confirm.)
 

Attachments

  • 0942am 1min.gif
    0942am 1min.gif
    21.4 KB · Views: 152
  • 0942am 5min confirm.gif
    0942am 5min confirm.gif
    18.8 KB · Views: 141
Last edited:
just out of curiosity, how is JillyB doing with her "7-am pivot thingummy" that she described recently?

The full back-testing on this just didn't give me the confidence to trade it. As I said in earlier posts the average pips per week just weren't enough to interest me - I think the drawdown would really scare me with this system. So I decided to leave it alone.

Having a really hard time with the trading at the moment. Things are definitely not going my way and I'm losing confidence and wondering - after 3 years - if this is something I can do. 🙁 Sorry to have a moan guys - bad trading week, has left my account really down.

Every time before I've dusted myself off and started again - but now I'm wondering why this time should be any different. Why should it work this time, when it hasn't before?

It seems that things work for a while and then everything goes pear shaped. In August I was up over 50% on my account for the year. Now I'm down -38%. September and October just haven't gone my way - or to my trading plan/strategy.

I think someone 'up there' doesn't like me very much.

Really sorry to have a moan - having a really bad day 🙁
 
  • Like
Reactions: BSD
looking for shorts today

And I guess that 1st sniff at the upper tier resist from July would be a good a place as any to take it on using the divergence type set up which bbmac has been extoling this week?

Pick your weapon of choice I guess (s-stochs/rsi) on your favored fast timeframe. It even printed an inside doji up yonder on the 15m to offer asistance.
 

Attachments

  • 15mdiv.jpg
    15mdiv.jpg
    30.2 KB · Views: 142
  • 5mdiv.jpg
    5mdiv.jpg
    36.5 KB · Views: 136
My 15min confirming set-up is attached. it's what i call a Reversal Extreme (ii) where when price reaches a first extreme (see red cci ..bottom oscillator) comes off then reaches another at which time the osma is showing same peak divergence and the macd has reached a bigger extreme, and the 10 bol (fastest...aqua) has now come inside the 20 bol white) This diffres from a normal Reversal Extreme where all osacillators reach extreme readings together.

Of course with stochs to 4hr being in the extreme o/b 90+ area at time of entry (0570bid) and with some sequential bearish divergence on the hourly still, it indicated a good pullback at the least could be on. Price has now only spike outside the recent 4hr congestion.

(15min confirming Reversal Extreme (ii) )
 

Attachments

  • 0942am 15min confirm.gif
    0942am 15min confirm.gif
    18.8 KB · Views: 138
Bids at 0505/0495 stops below 90 say mni, area of Dalily pivot, asian lo and 50% of yesterdays range with 50% of the weds recovery to todays highs at 0498 area too., 0460/50 0425/20 and 0405/0400 also potential areas likely to hold bis under here say mni.
 
a question

hi bb and ampro,
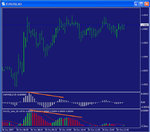
just following this stuff about divergences. Looking at eurusd, I can see the lower peaks in the macd and osma also, but this doesn't strike me as a short situation. How does this divergence differ from the ones on cable? (One answer I can see is that euro is not at any kind of key level as cable is on the 4 hour chart, but I'm interested in your replies.)
 

Attachments

  • 0710261211 eurusd 5 min.jpg
    0710261211 eurusd 5 min.jpg
    80.2 KB · Views: 116
Back
Top