peterpr
Established member
- Messages
- 609
- Likes
- 7
bracke said:I am very wary of comparing charts and drawing the conclusion that because one may appear to be similar to another the same will result. I think each chart should stand on its own two axis and be analysed as such.
Wariness is undoubtably commendable - I wish I was a little more wary sometimes! BUT
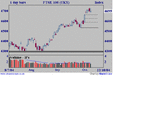
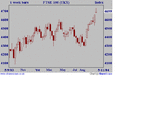
Charts are the footprints of real money (can't remember where I read that but I reckon it's pretty accurate). They show the dynamics of greed/fear interaction in the market over time. Pretty much every technical charting system tries to identify patterns and uses them to predict to the future.
For that reason I reckon that comparing the present with similar past patterns is (at the very least) helpful - it pretty well defines charting TA after all.
Which is not to say Pratbh's observation is in any way conclusive - because there are host of other parameters (not least volume, but also MA's and all the usual indicators applicable at that time) which need to be overlaid to see how far the congruence holds. The more that do, the stronger the predictive value - but it still aint foolproof.


