You are using an out of date browser. It may not display this or other websites correctly.
You should upgrade or use an alternative browser.
You should upgrade or use an alternative browser.
jonnyy40
Experienced member
- Messages
- 1,329
- Likes
- 11
1 the Averages discount everything
2 There are 3 trends in the market: Primary (or Major) Trend is the long term trend in price of stocks, which lasts from one to several years, and its discovery and confirmation is the main purpose of Dow Theory, Secondary reaction is corrective in nature, interrupting and moving in opposite direction of Primary Trend, (and Minor trands are day-to-day fluctuations). Also know as Tide, Wave and Ripple.
3. Primary Uptrends go through 3 above mentioned phases (bit similar to elliott wave 5 waves)
4. Primary Down trends idem in bear markets
5. THE TWO averages (industrials and Transports) MUST confirm each other. To signal a bear trend , both DJIA and Transportation Average must drop below the lows of their respective previous secondary levels. (Bull signal reverse)
NB. DT does not stipulatre a time period beyond which a confirmation becomes invalid, but the closer in tiome the signals occur, the strtoinger the signal is perceived to be.
A Trend remains in EFFECT until a reversal has been signalled by both Averages!!
6. VOLUME MUST confirm the trend, and only CLOSING prices are considered.
Looking at the chart on Bgold's thread,I think he would take the penetration of that 'double-bottom' low last december as a lower low.but the transports aren't confirming.
barjon
Legendary member
- Messages
- 10,752
- Likes
- 1,863
didn't seem to like it above yesterday's high - hovering around it
now so pausing for breath or thinking about retreat?
on the long term i go back to my post about the 3 corrections
over 5% won't be convinced this one's more than a correction
'til under 4260 or thereabouts.
now so pausing for breath or thinking about retreat?
on the long term i go back to my post about the 3 corrections
over 5% won't be convinced this one's more than a correction
'til under 4260 or thereabouts.
Hi guys wanted your views on this what ever they are if you have the time
http://www.advfn.com/cmn/fbb/thread.php3?id=6130353
Thanks
http://www.advfn.com/cmn/fbb/thread.php3?id=6130353
Thanks
barjon
Legendary member
- Messages
- 10,752
- Likes
- 1,863
hooya
this is all tied up with the question i asked sharescope about
opening gaps? they responded
"The opening price for the FTSE 100 is set according to the
guidelines set out by the LSE. They treat the index differently
when it comes to the open level as they do not reflect the early
morning auction period in the price."
barjon
Legendary member
- Messages
- 10,752
- Likes
- 1,863
hooya
no gap - opens on previous day's close. So I suppose the first
price is at auction close (0800) and then it's every 10 secs or so,
but I'm only guessing.
looks as tho' some obey LSE guidelines (sharescope, yahoo) and some make up their own (advfn?) all serves to help confuse us
poor saps 😈
I've not found the actual candles produced by both methods to be
contradictory too often and most candles (such as the doji you
drew attention to) need confirmation from the following price
action anyway.
barjon
Legendary member
- Messages
- 10,752
- Likes
- 1,863
not sure about "wrong" you could argue that the auction period
is valid trading albeit before they open the gates to the public, so
your "gap" would only be caused by missing out those minutes of
trading. What do the futures do during the auction period(s)?
anyway, it often doesn't mean much in terms of ta since you can
get the same answer. eg: i'm always prattling on about the base
of long candles giving support. so if the auction period results in
a long candle (up) i'd be looking for support at its base; if it's
shown as a gap then i'd be looking for support where it opened
up. 2 different pictures but the same support level drawn in?
FTSE100
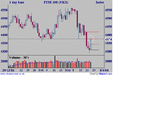
re last night's post we got the upside break of the 1 day SMA first thing. So trigger to go long activated. Notice the market ease back towards the the rising 1 day SMA late afternoon that resolved to the upside.
US markets currently very supportive
re last night's post we got the upside break of the 1 day SMA first thing. So trigger to go long activated. Notice the market ease back towards the the rising 1 day SMA late afternoon that resolved to the upside.
US markets currently very supportive
Attachments
barjon
Legendary member
- Messages
- 10,752
- Likes
- 1,863
hooya
not on mine - the 1630 call was 62 (ish) and the close 74 (73.6)
so i'm getting "official close" then that same number as "official
opening" tomorrow.
if your charts (advfn?) are not recording the official close then
you're right that something seems amiss. what's their
explanation.
not on mine - the 1630 call was 62 (ish) and the close 74 (73.6)
so i'm getting "official close" then that same number as "official
opening" tomorrow.
if your charts (advfn?) are not recording the official close then
you're right that something seems amiss. what's their
explanation.
barjon
Legendary member
- Messages
- 10,752
- Likes
- 1,863
mully - good one 😀 without giving too much away, on what
basis do you fix your stop loss?
interesting maybe that ftse closed up against double resistance
(one from mid-point of long down candle and one from previous,
tested support). If DOW continues it's merry way, the opening
should put paid to it when 418 becomes the next hurdle. On the
downside some support around 342 maybe.
tomorrow will reveal all
Attachments
interesting day ?
not only did the market turn but it pushed through 4360 at the end and broke the down trend line in the process.
however, it was all auction action, so provisos apply.
there may be touble ahead
but while there's ..........
4400 looks tricky ?
if it's a serious move upward, I would expect it to retest that trend line at some stage.
Morning all, just popped in to say hi. Hope you are all doing ok. I got a bit stung by the auction last night but other than that had a good two weeks. Been really concentrating on the intraday chart and ignoring (to some extent) the "bigger picture" and it seems to help my trading.
Similar threads
- Replies
- 5
- Views
- 49K


