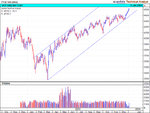
FTSE 100 January

  • Thread starter Thread starter bonsai
  • Start date Start date
  • Watchers Watchers 6
good morning Bonsai, thought I would drop by with a piece of interesting statistics, which is for the US:

The market action during the first five trading days of January often serves as an excellent indicator for the year as a whole. This year is election year in the US. Since 1950 there has been 13 election years. There have only been 2 cases in those 13 election years when the 5-day indicator did not work. Otherwise gains in the first 5 days meant a positive year and a loss in the first five days (as measured from the open of the first day to the close of the fifth day) meant a negative year. The only time this did not work was in 1956 and in 1988.

If you look at ALL the years between 1950 and 2003 (and not just the election years) the indicator losses some of its accuracy, but it is still better than a clip-of-the-coin. Since 1950 there has been 33 years with gains in the first 5 days, and in 28 of those years the market ended with gains for the year. In the 5 years the indicator did not work, there was a war in 4 of them, which affected the market.

Happy New Year
 
Hi Tom

the rule of thumb is that if the NFC win, the market will rise
for the year.
As Hooya said , it didnt work last year but statistically has been a very good indicator.
(Can't really think of a more spurious correlation)

From memory, its an 8 out of 10 statistic.

There must be a web link somewhere but its a favourite of CNBC.
(Bit like Greenspan's briefcase)
 
Range decreasing
 

Attachments

  • screenshot023.gif
    screenshot023.gif
    11.2 KB · Views: 720
small break out north..if it doesnt gather pace I guess
we are trading ultimately sideways and not in the triangle shape
 

Attachments

  • screenshot025.gif
    screenshot025.gif
    7.1 KB · Views: 689
even if we do break out, I am not sure we will go very far.
maybe to 30 ? before another stop and think.
triangles are meant to have projections built in, arent they ?
 
Hi Bonsai

The price is supposed to move the distance of the "triangle mouth" once it breaks. I know your looking at a smaller triangle, but I think the target takes the price to about 4540 🙂

<img src="http://www.ftsebeater.btinternet.co.uk/UKX050104.png" width="416" height="306"</img>

Click here for large chart
 
thanks FB

a bit concerned though as to whether your chart does show a 'triangle'

the bottom line seems a bit imaginative ?

what do you think ?
 
Hiya Bonsai

hmmm I can see what your saying, but here's my defence 😉

The bottom trendline has 3 touching points, plus a close 4th touch. The top trendline has 3 clear touches. The 2 trendlines combine to make a triangle formation, so therefore I believe I'm justified.

The defence rests your honour 🙂
A shaky defence, but a defence nevertheless :cheesy:

As a bonus the triangle broker 2/3rd's of the way down, which apparently makes it more likely to hit it's target 😎
 
thanks Fb
as you may gather, I have problems trading triangles so I usually
leave them out unless they conform to elliott and have clear
line touching internal waves.

it was the starting point that made me ask the question.
looking at the chart leading up to that point didnt seem to suggest that a triangle might be starting. Don't most upward triangles start with a down move ? thereby fixing the 'mouth' .

?

edit
by an upward triangle I mean one that breaks upwards.
 
Last edited:
Hiya Bonsai

The way a triangle will break has more to do with how the triangle has formed rather than where it came from. If you have an ascending triangle (flat top rising bottom), then it is more likely to break upwards.

If the move leading to the triangle had been up and the price continued up after the triangle had broken - then the triangle would have been a continuation pattern. However if the move before the triangle had been down, then the triangle would have been a reversal pattern.
You don't know where it's a reversal or a continuation until it breaks.

The most important factor in governing which way it will break is the formation itself. Ascending, descending or symmetrical 😎

Hope that hasn't confused you further 😕
 
oh surely, FB. I'm more than familiar with that sort of thing.

it was the lack of mouth at the start of your triangle that is the puzzle and why I wouldn't have called it a triangle.

I personally drew two parallel line sloping down.

see chart.
 

Attachments

  • triangle.gif
    triangle.gif
    7.8 KB · Views: 507
bonsai said:
oh surely, FB. I'm more than familiar with that sort of thing.

Hi Bonsai

Oops, Apologies my good man - I forgot for a second who I was talking to 😱

Now this is interesting. I can see triangles better than channels, and it sounds like you prefer them the other way round 😛 .
I believe there is enough of a mouth there, but I also believe that your channel is just as valid....if not more so 🙂

I suppose at the end of the day it comes down to this. If you saw the pattern, how would you have traded it?
 
Lee
don't often use stockpoint charts so I'm not sure.

and they dont seem to time stamp their 1 min charts

are you talking Uk or US stocks/indices ?

will keep an eye out for it though.
 
looks like the sideways pattern held today. But FTSE beater's
longer term triangle looks spot on to me


lol But Bonsai's Channel looked good too🙂
 
Last edited:
I prefer the tramlines - is this a possibility 🙂
 

Attachments

  • ftse 100 (2).jpg
    ftse 100 (2).jpg
    418.8 KB · Views: 473
Back
Top