You are using an out of date browser. It may not display this or other websites correctly.
You should upgrade or use an alternative browser.
You should upgrade or use an alternative browser.
I also try to keep things simple - in fact have just got rid of one indicator (CCI) because I think I was trying to read too much from them all of the time.
I use 15 min candlestick charts (AIQ/Mytrack) as I dont like all of the 'noise' on 1min/2min/5min etc with EMAs, MACD and volume - still sounds like a lot of indicators I suppose!
I use 15 min candlestick charts (AIQ/Mytrack) as I dont like all of the 'noise' on 1min/2min/5min etc with EMAs, MACD and volume - still sounds like a lot of indicators I suppose!
Bonsai,
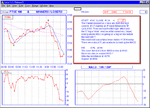
I assume the blue line on your 15m chart is the MACD. Do you have specific settings to produce it in this fashion and have you any idea how I might be able to reproduce the same on my Sierra charts.
I have read a little on Elliott Waves in the John Murphy book and understand the basic principle but have never been able to break it down to near time charts, such as intraday. If I do sometimes get it right it is more by luck than judgment. You appear to make good use of this technique, are you able to point me in the right direction as to where I may improve on this theory, something that might SPELL it out in layman's terms.
I am currently trying something out with the 15 m chart trading through D4F trying to trade the intraday trends or waves currently using a 2 SMA to assist with this but it would be nice to try and work out the waves in advance.
Kevin
Kevin
The chart called MACD (bottom right) is the MACD
the blue line you refered to is a 1 hr sma.
On Elliott, a good one to start with is 'Elliott Wave Principle'
by Frost and Prechter.
It is a concept considered to be fractal so applies in any time frame but shows up best in 1 hr plots.
again I would suggest line charts.
Similar threads
- Replies
- 866
- Views
- 112K
- Replies
- 478
- Views
- 70K
- Replies
- 197
- Views
- 33K

