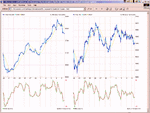
FTSE 100 Intraday - December

bonsai

thx for saving my tired legs and easing my confusion (my 9.37am).

the mid-point of monday's long white did its job again but
where's some real volume - when it comes, this pit-a-pat table
tennis should go with a PING (or a PONG).

not getting much concentrated time at the moment so ftse
trading suffering while I deal with my swings - will still have
enough time in the evening to be wise after the event though!!!

good trading y'all
 
Well at least the buyers at 4372 are still active this morning. Is is now a case of seeing whether the sellers are still active around 4388. Great trading range market for scalpers.
 
"In Place of Fear" ?

Not quite what Aneurin Bevan had in mind, but it seems (maybe)
that with the Dow so close to 10,000, its time to wait.

It 'could' easily move or gap to 10,000 ?
And then tank,tank,tank !

Nobody wants to be last man in ?

And if the Dow tanks, I think FTSE may want to already have
completed its 2 wave.

Abroad thoughts from home !

edit
 
Last edited:
maybe this, maybe that ?

elliott suggests the top has been in for a few days ?
 
now you know why we visited 4360 a few days ago ?

and now its probing again ?
 
I'm still of the same mind as when I posted previously; that the top was formed on the key reversal day (26th November).

Recent price action and the divergence between the Dow's behaviour and that of the FTSE puts another tick in the box. If I'm right, I wouldn't expect 4400 to be breached next week at all. All recent moves above 4390 have offered relatively low risk opportunities for me to increase my short positions.

We'll see what next week brings now. I'm only ever right until I'm wrong :)
 
Bonsai,do you ever use futures options?If yes,how often and how do you find them?
 
do you mean options on futures ? as opposed to Index.
sounds like an sb special to me.

but no I dont.

don't use options very much at all anymore.
most buyers lose and selling them is profitable but very very risky.
imo
 
morning hooya
lol

but you are right, it hit my trailing stop.
at least I managed to cover the tip I left yesterday.
 
:)

must admit Im a bit lost at the moment. I know I shouldnt be thinking ahead of the action but, my US charts look like they want to make a new high but FTSE' saying "I dont wanna play that game"

So a bit clueless really. If the top is in, im a bit surprised we havent been more impulsive rather than this sideways range sinice 26th? and my 60 min indicators arent any help thanks to the trading range.
 
Last edited:
I was looking at the Ftse this morning, in particular the small wedge that has been forming over the last day or so. I panned out and realised it was part of a bigger wedge lasting several days. So I panned out more and it's part of an even bigger wedge from September.

Then I thought that this also makes it into a bullish flag from March.

Then the Ftse broke down through the small wedge.

Anyone want to add their tuppence as to the significance of this?

I agree with Bonsai that we could have just had a wave2, it counts well. I'm just concerned that the Ftse hasn't hit target at around 4450, which would allow for a spike up form the bullish flag.

My own analysis says that a top could be in, but is more likely to come in early January. Of course the Jan top could be a wave 2 or B of a larger down move.

Guess none of this is helpful, but perhaps someone else can add something to make it useful. :confused:
 
? fractal fragments ?

hb, I think its very helpful.

I guess its possible that we have seen a failed 5th ? but I also
expected it to test at a higher level.Or should I say a 5th which
failed to reach its target ?


end of Jan for a 2 of larger degree looks quite possible and plausible.

edit
 
Last edited:
but remember a wedge is just a line across the highs and across the lows. so you will always beable to find a wedge, expanding wedge, or channel on any chart in any time frame
 
very good point hooya
its one of the problems I have when people talk about triangles.

except elliot who gives a pretty clear definition.
If you use his definition, its surprising how few there appear
to be.

and flags as well HB. I thought a flag is meant to fly at half mast ?
do you agree ?
 
re discussion about lack of clarity for FTSE100, you could look at my post of yesterday that compared the FTSE100 to the FTSE250. Since the 21/11/03 there has been clear implusive action in the FTSE250 (similar to DAX and SP500). However, clearly there has not been clear implusive action in the FTSE100- blame both GSK and AstraZeneca.
Looking at FTSE250 there appears two implusive waves from the 21/11/03. and we may be in wave 4.
 
Here are the charts again
 

Attachments

  • chart.gif
    chart.gif
    74.1 KB · Views: 218
However, Bonsai just cause a triangle doesnt form to elliott theory doesnt mean its not significatant, after all the two lines that form a triangle are just support and resistance line. The only difference is an elliott triangle would indicate a certain direction I would guess.
 
Top