FTSE 100 Intraday - December

triangles have projections associated with them.
its their main value ?

you only ever see examples of successful outcomes.
but similar patterns are not called triangles (because they fail the prediction)

and flags at half mast also have predictions . They tend to come
true but only in the middle of an impulsive move.
 
anyway, its all academic to me as I dont trade that sort of pattern.

but what I see on ftse is that the 1 day itself has made a lower high and is falling etc.....
price failed to break up through it ...
and we are off again
 
No.1 Tip:When you've set your chart to a range,make sure you've set it back to automatic when you need to.
 
Interested ?
Ftse has broken its trend line from the last low at 4277
but Dax has not (yet) !

however the dax has hit its 62 fib from 3894/3696
 
Last edited:
I ought to add as a trading note that if you think a
flag is being created, it is the perfect time to pyramid.
if it fails you still have the profit from the first move to protect you
and if it succeeds you have a low risk entry.
and twice the profits on the second move.
 
Channel?
 

Attachments

  • screenshot041.gif
    screenshot041.gif
    5 KB · Views: 484
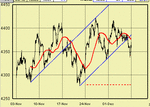
that may be a channel and it may trade very well.

the only problem with channels is that they appear and disappear.

why dont we always see channels ?
all the time ?

sometimes they work, but I would hate to have to pay a fiver for every one that failed for some reason .

puzzled.
 
mind you having said that, sometimes the 1 day doesn't work either.

lol

(but it is objective)
 
Here's a funny thing. The 3x3 1min hilo P&F break down at 4374 gave a count of 54 from the top of the pattern at 4395. That's 4341. The low is......... 4341.


edit....no I didn't
 
:rolleyes: :LOL:

it doesn't matter whether you took it or not.
anyway I dont think you get asked questions like that on this thread.

but it is interesting.

poor cat gets skinned so many different ways ?

(I don't like cats)
 
:LOL:
like a target, you mean ?

a moving target - like Paul Newman.

- No -

:LOL:

Because its not subjective. I can't personally influence it.
Its not a perception or opinion.
that sort of thing.
 
but is a line from one point to another any different?
ok i choose which points but you chose what
MA settings; is there a difference really.

Sorry, Im in a arguementative mood LOL. What a
disappointing week really on the FTSE imo.
HAve a good weekend all. Expect the gap fill on the US
chartsbefore any major fall. They are pretty relyable
 
it's not you; I started it.
:LOL:

here is a chart of the ?channel? I have .

Bottom line started off all right, hit the top line -fine,
came back and hit the bottom line -fine but then failed to return
to the top line.
But probably not a purists channel.

break of bottom line gave me a trade today and may turn out to be important.
 

Attachments

  • dec5.gif
    dec5.gif
    7.7 KB · Views: 318
Last edited:
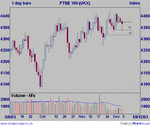
Another week dominated by the long white candle on Monday.
As last week, the mid-point held for 3 days before succumbing
today although the base support still held well (S1). Once again
volume was low all week but a bit higher than last week. We now
have long candle support at both S1 and S2.

Given DOW close, S1 looks like it will be tested first thing Monday.

The final candle is hammerish in nature and therefore positive
although it would have looked a bit different without the last ten
minutes or so flurry when there was a massive volume spike of
over 350m (volume only totalled 774m all day) which moved us
up around 10 pts. What do your trained minds make of that
volume spike?
 

Attachments

  • ftse2.gif
    ftse2.gif
    14.8 KB · Views: 340
I am biased. You know what I think of volume.

But I would suspect the second leg of the flag at half mast was
on low volume, thereby indicating a reversal was possible, so
they bought into it.
Making a higher low in the process and pulling more people in because of that !

Sounds like good trading to me.
But it all showed up in the macd.
 
Top