FTSE 100 February

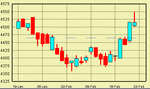
I was under the impression that the futures led the cash. While we were rallying strongly the futures were above the cash. They have been below it for some time now, and below fair value. Do you attach any significance to this?

I suspect you may need to be more specific, but here goes anyway.

I am not sure how you calculate your own 'Fair Value' which you say is higher than the Futures quotes.
It is a very complex calculation which probably neither you nor I can do satifactorily. Apart from the time value or diminishing interest cost associated with holding futures to expiry, you also have to include the value of dividends you would be entitled to if you held shares which are going ex-div prior to expiry and recalculate relevant market caps after each ex-div event. (usually Wednesdays).

March quarter is traditionally a period when a lot of large companies go ex-div and the holders of futures don't get that dividend. So FTSE Cash is always 'Cum div' and Futures are always 'Ex div'.
So that is a major part of the current difference you experience at the moment.

Different quarters carry different effects of this phenomenon.

However spreadbetters are very very aware that if they do not get it right, we will all make money at their expense.
so, a good rule of thumb is to compare their Cash and Futures quotes.

You might be able to get hold of an independent calculation for Fair Value. e.g the F.T used to carry it in their commentary on the futures activity.

So, if after adjusting for the correct Fair Value, Futures are seen to be trading at a discount, then yes, I think it is significant, and could well result in the Futures leading the market to lower levels.
 
Bonsai


Thanks very much for going into such detail in your reply. I am sure you get tired of all these questions.
It is just great for everyone to have someone as knowledgeable as you who is prepared to have the patience to deal with them all. Thanks again.

Jean
 
I forgot to say I get Fair Value from an email I get most days from a broker who gives advice for trading in options. Not that I'm interested in trading in options but the information can be useful.

Jean
 
bonsai

Thank you kind sir. Time for your attentive student to let you
get back to preparation for tomorrow. There's that upthrusting,
long-legged doji to worry about after all!!!!

good trading

jon
 
"btw, I think the current wave started at 4082 (not 4357)"

:LOL: you really know how to confuse me. here I am talking about the wave from last week and we go back to October and start talking about future wave counts that could take the next 2 years or more.


I do understand that every correction is an abc but get a bit lost knowing which is correcting which move. The trend is up so I made the original move off the Jan highs an A with the recent move an abc 'B' as it is correcting the impulsive A down but we have made a new high which has thrown a different light on it. Oh well makes very little difference to my trading. We have turned a few 60 min indicators on Friday on my charts and we have two gaps to fill or at least worth watching.
 
Last edited:
I think I said earlier that I was trading it as an a/b/c.
The fact that its gone to a new high, of itself, is not enough to change that. B can finish higher than the original high.(but not by much)

It will be the next move that is important.

If it turns out to be the 5th of the 5th from 4082 then .........
(very complicated count)

The other scenario is that we are starting some sort of 4th wave.
(whipsaw country ?) I was quite impressed by the way it traded up those fib fans.

BTW,
There were several different fib fans at work this week.
As I haven't posted a chart on any of them, how about this one ?
The first line is from high to low on the fall. The second line is at 50% of the gradient of the first !
<img src="http://web.onetel.net.uk/~gawgaw/fibfan.gif">
(always worth plotting)


Barjon's doji (or what I call a hanging man) on Friday may be the clue ?

(I do not have a satifactory count on the pull back which finished on 12th.)
 

Attachments

  • hm.gif
    hm.gif
    4.9 KB · Views: 304
Last edited:
mmm, yours looks a shooting star rather than my long legged
doji. still negative but needs confirmation by early downside action.
 
Thanks again Bonsai..sorry to be a pain :LOL:


Mully, indeed. Have a feeling the $ might fall a bit through out the day. Will have to see currently $1.8573...looking for short entry on FTSE
 
there are some opening gaps I don't trade. And this is one of them.

I never trade it against a new high.
 
probably a good move. Im waiting for a signal and a good one could be when the steepest trendline gets broken.....
 

Attachments

  • ffttr.gif
    ffttr.gif
    65 KB · Views: 378
think it could be one of those days where it's better to pop back every hour or so and see where we are.
 
hey, ho - just sittin' and waitin'. Anyone active?

All that negativity nullified by the strong opening and new high.
Another high shadow today wouldn't surprise, but I haven't bet
on it!!
 
morning all, im still short from a few days ago. averaged down when we hit 4547, expecting a slow gap fill on the FTSE and some more downside in the US.


taking ages, but its getting there.

FC
 
LOL im in from 1.83. had to leave FTSE alone as my charts are all hovering in no man's land
 
Finally stopped out of dge short. That's 3 bites I've had at dge
recently - all wrong. Could have taken + 25 from the last one if I'd been more alert dammit Better go contrarian!!! Maybe a bit too
tied up to $ moves.
 
Top