You are using an out of date browser. It may not display this or other websites correctly.
You should upgrade or use an alternative browser.
You should upgrade or use an alternative browser.
barjon
Legendary member
- Messages
- 10,752
- Likes
- 1,863
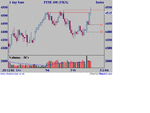
ooh - er a long legged doji with upthrust on the third peak of
a potential triple top 😈 only saving grace is that volume
was highest on the third peak. Still looks pretty negative
though, so much so that they may play games first thing
Monday :?:
I've shifted support to the base of the two long whites. S1 isn't
far below fib50% @ around 454. Triple top target (if that's your
thing) would be around 236 :?:
Weekly looks quite healthy tho' - will post over week-end.
ps: does EW let you go from wider picture to narrower :?:
ie) does it work on a weekly or monthly plot.
Attachments
Last edited:
yes, elliot can be used in any time frame.
unfortunately one swallow does not make a summer
so the high today is not too high to rule out the end of the 'C' wave, which would complete big 'A' from 3277 with a consequent start of big 'B' wave down to who knows where.
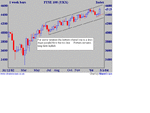
the first test will be whether the channel bottom line will now provide support. It is at 4493ish.
If that breaks conclusively, then we must find support around 4445 if we are to remain in this uptrend.
4465 was sliced through, so that may yet prove to be an intermediate support level ?
But this market has been full of surprises as usual and a continuation of this strong move up to 4550 cannot be ruled out yet.
Last edited:
Windlesham1
Established member
- Messages
- 532
- Likes
- 60
The strength of the upside caught me out,but I live to fight another bull,sorry,day!
Bonsai
I assume when you talk of the big B wave you mean down. Sorry for my ignorance I'm not very up on EW.
Although the rally of the last two days appeared strong I do get the impression that the first sign of weakness in the US markets sparks a wave of profit taking. After nearly a year of most stocks making reasonable up trends I think a lot of people may be ready to take profits. I have taken virtually all money out of stocks and am sitting with cash. This is probably wishful thinking and I shall be proved horribly wrong and everything will now fly upwards!!!!
Jean
barjon
Legendary member
- Messages
- 10,752
- Likes
- 1,863
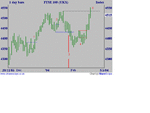
.... and then the swing chart which is a bit more complicated.
After the repeat long signals at 1 and 2, the change of trend at 3
with the subsequent short signal at 4 look to have been false. Not
certain for me yet since I need a close above earlier highs. The
intraday move above at 5 will have already persuaded some that
we are back in uptrend, but it may have been an upthrust to test
the ground (and/or to kill some stops)
Attachments
As I seem to have been confusing or ambiguous or all of the above, I have gone back and edited my earlier post although I think Jean has grasped what I meant.
I have been assuming that the whole of the rally since 3277 was a big 'A' wave and think I have said so several times.
There is room on my hourly chart for a run up to 4750 but if we dont rally now then the bottom channel line will have failed for a second time.
I am suggesting that would be a bad omen and possibly the start of a change of trend. That would involve a big 'B' down.
(especially as we have only been scraping along just above the bottom channel line for over 3 months).
I did take your remarks Bonsai as looking at the bigger picture.
It is what I personally am hoping for. I think a lot of shares look tired and are ready for a large retracement. My reason for being in cash is I'm looking to get back in at levels quite a bit lower than they are now. As I said before perhaps I've got it all wrong. I think we could find out fairly soon with both the Dow and the FTSE having double topped and the S&P and the Nasdaq looking to be somewhat struggling at certain levels.
Jean
Ah that Big B 🙂 but although I can obviously see the abc that most of us have been following over the last month still not sure its relationship to the previous move...hence my ABC flat correction theory. Ulitmately I can't see how and abc correction making a new high can be the top? Am I missing something?
barjon
Legendary member
- Messages
- 10,752
- Likes
- 1,863
bonsai/hooya
This is where I start getting really confused. In the very long
term the market is always rising, 20 years ago ftse was around
1000. Doesn't it follow that any major correction (bear market)
must always be an A,B,C correction to the very long term trend?
On this basis if no A.B,C can be seen on the down from 2000 high
to the 2003 low then it must merely be the A and we're in B with
C to come? Seems unlikely given three years of the bear?
Alternatively if A,B,C can be seen we are in (or just completing)
1 of the next 1 - 5 move in the very long term trend? That means
that the big B you are talking would be the beginning of the 2
wave of that very long term move?
That's why I asked about time frames. Presumably it's possible
to arrive at the shorter term wave from the bigger?
I've probably got the logic all wrong, so don't waste too much
time trying to explain it.
barjon
1) YES, elliott theory says every correction must take on an ABC formation.
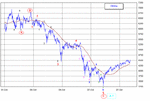
2) I have an ABC count as per attached chart. But is that the end of the bear market ?.
I don't think so. Therefore I classify the fall to 3277 as Major 'A' only.
3) from 3277 I expect we are in a Major 'B' wave which will have an 'abc' formation. It is the end of that 'a' which is now on the line (maybe), to be followed by a 'b' down and then a 'c' up to complete. (6000 ?)
4) After that will come the Major 'C' to test the whole of the previous rally from 3277. (which I do not expect to get broken)
I only set out the above in order to explain what I have previously posted.
I am not forecasting that all this will happen, I am only explaining why the current 'a' features at all.
It may not fail but carry on rising, but I would still classify it as an 'a' and if it reached 5114, it would not surprise me.
(see my chart at the start of this thread.)
Attachments
Bonsai
Thanks for taking the trouble to explain all that.
I was under the impression that the futures led the cash. While we were rallying strongly the futures were above the cash. They have been below it for some time now, and below fair value. Do you attach any significance to this? I think this was touched on before in which case I'm sorry to raise it again but I don't remember your reply.
Thanks.
Jean
barjon
Legendary member
- Messages
- 10,752
- Likes
- 1,863
bonsai
Thanks, that's cleared the theoretical mists. Now I've got to
get to grips with actually spotting the waves (I understand
that's the easy bit 😆 )
Just a couple of supplementaries to add to your growing list of
questions. (accepting that you're not soothsaying!!)
1. Why would you not expect 3277 to get broken?
2. What would persuade you that the bear market IS over?
jon
barjon
when we were at 3277, the yield on equities was greater than the yield on bonds.
i.e the market was available on the basis there would be zero growth.
the opportunity of a lifetime ?
do you think that will happen again ?
you only live twice ?
lol
when we talk 'bear market', we are talking FTSE ?, yes.
what would persuade me that the bear market was over ?
some event that has not yet occurred.
who knows what ?
it will not have been discounted in advance.
hooya
every correction is an abc ?
so we will always finish on a 5 leg 'c'
btw, I think the current wave started at 4082 (not 4357)
anyway, all this talk of downside is beginning to make me bearish and I am not.
At the moment the trend is up and the break of 4516 means the next target is 4750 where the trend lines cross and after that it is 5114 which is 50% high to low.


