You are using an out of date browser. It may not display this or other websites correctly.
You should upgrade or use an alternative browser.
You should upgrade or use an alternative browser.
not at the moment they are not but know what you are saying.
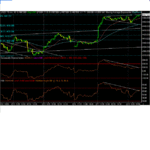
but Im talking more about the signals. Its not like you are going to get the same trade able patterns etc in a FTSE 1 min chart the same as in the US imo. Obviously if you are willing to trade at twice or 3 times the stake for a 5 point move then maybe. But I trade for 20+ point moves which would be the equivalent of 40dow points. To do this I have to use a 5 min chart 1 would give me false overbought RSI reading etc but in the US it would be fine imo
but Im talking more about the signals. Its not like you are going to get the same trade able patterns etc in a FTSE 1 min chart the same as in the US imo. Obviously if you are willing to trade at twice or 3 times the stake for a 5 point move then maybe. But I trade for 20+ point moves which would be the equivalent of 40dow points. To do this I have to use a 5 min chart 1 would give me false overbought RSI reading etc but in the US it would be fine imo
no you are not doing anything wrong but very hard to trade the US and UK the sameway. Print out a 1 min chart just with RSI for both UK and US at the end of today and see the difference. Remember a 5o dow move and 5 point ftse move arent the same....the spread on the FTSE is 40% but the US is 10%. It all
comes down to whats tradeable
edit:
btw the above refers to theoretical point s from a 1 min signal
obviously a 5 point move is roughly 10dow points
comes down to whats tradeable
edit:
btw the above refers to theoretical point s from a 1 min signal
obviously a 5 point move is roughly 10dow points
Last edited:
dont keep daily track of market cap.
Its far too complicated
but if you go here, you can pick them off manually.
<a href="http://uk.finance.yahoo.com/q?s=^[email protected]&d=v6">Yahoo- Ftse</a>
Its far too complicated
but if you go here, you can pick them off manually.
<a href="http://uk.finance.yahoo.com/q?s=^[email protected]&d=v6">Yahoo- Ftse</a>
thanks for your views on the waves Bonsai.
Jonny not going to give you my signals 😆 but dont forget the FTSE daily range average is about 39 points this year so you only need to get 50% of it. Btw I am short> I have no idea whether it is going to be a winner/ loser or by how much but I know my signals traget the bigger moves than they would in a 1 min chart. Which was the point I was trying to get across to Fin.
Jonny not going to give you my signals 😆 but dont forget the FTSE daily range average is about 39 points this year so you only need to get 50% of it. Btw I am short> I have no idea whether it is going to be a winner/ loser or by how much but I know my signals traget the bigger moves than they would in a 1 min chart. Which was the point I was trying to get across to Fin.

