You are using an out of date browser. It may not display this or other websites correctly.
You should upgrade or use an alternative browser.
You should upgrade or use an alternative browser.
apparently according to Tom H next week President's
week is statistically the strongest of the year with a 10 out of the last 10 finishing up? But would have to double check it.
edit and just read that today i.e the day before President's Day
is statistically weak...
week is statistically the strongest of the year with a 10 out of the last 10 finishing up? But would have to double check it.
edit and just read that today i.e the day before President's Day
is statistically weak...
Last edited:
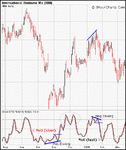
In Hooya language its one thing moving in one direction and the other thing moving in the opposite direction. Trading wise we
use it to describe a divergence when we expect two things to move in the same direction. Which chart you talking about?
look at the last chart on this page http://www.trade2win.co.uk/boards/showthread.php?s=&threadid=8453&pagenumber=4
use it to describe a divergence when we expect two things to move in the same direction. Which chart you talking about?
look at the last chart on this page http://www.trade2win.co.uk/boards/showthread.php?s=&threadid=8453&pagenumber=4


