You are using an out of date browser. It may not display this or other websites correctly.
You should upgrade or use an alternative browser.
You should upgrade or use an alternative browser.
barjon
Legendary member
- Messages
- 10,752
- Likes
- 1,863
fa la la, drifting down the river with the breeze whispering in the
trees. Only shock was the girl on Radio 5 news at 1 o'clock
announcing that ftse was UP 12 - sent me scurrying to the screen
I can tell you!!
Been having a mass clear out. Gone round full circle for the
umpteenth time and ditched all the bells and whistles to leave
the simple basics - even opened a new watch list entitled
Mully's 8 Year Olds!!
I'll be there again tho' since bells and whistles are so intriguing
even if they do play twentieth century music most of the time
which only the true afficionado can appreciate.
barjon
lol
if you want something old fashioned ? do you want to try this.
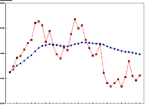
you will need to download ftse from last expiry to date into a spreadsheet.
then caculate a cumulative moving average. That is an average for each day that contains every day since last expiry.
if I remember the signals where buy on break above ma and sell on break below ma.
no bells and whistles on this one, its from the days before computers.
barjon
Legendary member
- Messages
- 10,752
- Likes
- 1,863
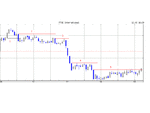
a good day for the candles?
the scene was set when the base of the long white was breached by the even longer blue (1) - bit of hindsight here but
macd did signal down soon after 😉 . The top of the long blues
held as resistance (2,3 & 4) and so did (5) until the death.
the scene was set when the base of the long white was breached by the even longer blue (1) - bit of hindsight here but
macd did signal down soon after 😉 . The top of the long blues
held as resistance (2,3 & 4) and so did (5) until the death.


