FTSE 100 - April

Status
Not open for further replies.
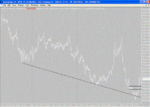
as a follow up to my long term chart which I posted a few days ago, I have now updated it (guilt)

the crossover point of the 2 trend lines has been lowered somwhat and is now standing at 4650

The old bottom channel line is now at 4660

coincidence ?

eyes left !!!! for what's next
 
anyone here work with fib time clusters ?

Hungry Bear ?
what are they suggesting ?
 
when I open up T2W using my favourites link this is the first line of the first post that opens up and it seems to sum up today..


"odd sort of trading day" :)
 
with a 20 point range yesterday finishing at the same close as Thursday it has an air about it. The DOw seemed to do a nice abc last night but FTSE still holding above its trendline and looking corrective so a bounce seems quite likely at the moment
 
Call me simple, call me stupid etc...BUT I thought I saw a classic "bonsai" sell signal first thing this morning. A rally up to the 1 day SMA followed by a clear rejection.


Just goes to prove it is all in the eyes of the beholder.
 
like a good chess player you have to be thinking a few moves a head:)
 
Last edited:
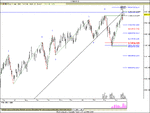
Thought I would post this here too but want it to complete sooner rather than later as being under the trendline makes me feel bearish
 

Attachments

  • erew.gif
    erew.gif
    52.7 KB · Views: 333
mully
not quite
macd was below zero and rsi was almost oversold
but a trade nevertheless

still looks on for a big move

probably up 4650 ?
 
Well that makes a pleasant change, placed a lay bet on FTSE not touching 4550 at 92 points for it (Cost of 8 points). Looks like it could expire at 0 giving a nice 92 point gain :D.

I have to admit it came a bit too close for comfort :)
 
nice one 99


c turned out to be 1.618Xb so it was all rather neat and tidy for a change?. Next stop 4600 maybe? then after a pause Bonsai's 4643?
 
Take out stops?? Perhaps support from 100ema on 1hr chart
 

Attachments

  • untitled.gif
    untitled.gif
    89.6 KB · Views: 301
the move off the highs to the low this morning looks very short, as if its not finished. Think we need and EWaver!!!.
 
bonsai said:
anyone here work with fib time clusters ?

Hungry Bear ?
what are they suggesting ?

I do, and here is a chart of the FTSE 100, look at the big spike on the 23rd. The oscillator has also turned down, so it looks like downhill from here but no confirmation yet to a down trend.
 

Attachments

  • ftse100.gif
    ftse100.gif
    89.5 KB · Views: 277
Status
Not open for further replies.
Top