Dow 2007

Bad trading on my behalf, totally F**ked that entry up.

30 min stoch breaking the roof
15 through 5 all excess mid 90's


No stop loss or limit close entered on this trade, and missed my 20 point s/l, so as we are currently HOD, I will manage manually, heres hoping, but I fear the worst on this trade, will close when and if the pain becomes to much to bear!

If the conditions permit, I hope to take a further short to ease the pain, back of my mind though, tells me this is a loser and I am going to have to take the loss, I failed to act on the 2-4 hour charts which look bullish.

Basic errors from me

Thanks Dinos.

I was curious as I could not see anything on my 1 min chart using DEMAs and was at the time staring at a long DAX position which was going precisely nowwhere...........

Basic errors :eek: Glad to see I am not the only person who makes them !

You still on ?
 
Either someone is artificially keeping this up, or the big boys are buying ready for the next big move up. I'm seeing over 100 cards on the bid each price 10 from the market!
 
Either someone is artificially keeping this up, or the big boys are buying ready for the next big move up. I'm seeing over 100 cards on the bid each price 10 from the market!

what does artificially keeping this up mean?
to my knowledge people buy or sell and the market goes up or down as a result
 
Just got back from taking my son to his golf lesson, my dow trading today is disorganised, set a limit order to close my short from 60 at 35 and escaped from jail on my short from 28, so +17 in all.

Not a happy chicken today, so unless anything else concrete develops, I don't intend to trade again today.

Hi Robert,

Thanks for your message, I'll PM you again shortly. Just went short at 304, a little premature I fear. Hoping the HOD is in. Speak soon.

P.S. Hoping the engulfing candle on the 5 min plays the game!

cheers - Tricks
 
Hi Tricks

Good entry point, 5 min thru 1 hour look good for some southerly direction, I was contemplating an entry and was tempted at (cash) 299, but as per my previous post, I'm not trading well today, so I have to be disciplined and not trade again today.
 
Hi Tricks

Good entry point, 5 min thru 1 hour look good for some southerly direction, I was contemplating an entry and was tempted at (cash) 299, but as per my previous post, I'm not trading well today, so I have to be disciplined and not trade again today.

Hi M8,

Got stopped out at BE on that one, and could have taken 18 pips as well. Ah well, 'c'est la vie'
 
what does artificially keeping this up mean?
to my knowledge people buy or sell and the market goes up or down as a result

Well, it looked a little too one sided. I was wondering if the Fed were doling out more cheap money, or if the PPT were at work lifting offers. Ian, I was reading the order book.

I was up +22 at one point today, reduced to a mere +8 now after getting wipped on a bad trade and rather frustratingly missing the price 4 times in a row as I tried to cover. Unless there is some extra volatility and a good setup into the close, I'll remain flat for the day.
 
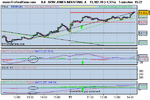
Slow smoothed MACD on the 5 min chart

I was given this setting by an renowed trader, it really works a treat on the 5 minute chart and for those of you who enter a trade to early/late and exit early late, its worth having a look to see if this may help.

Using MACD setting (55, 144, 34), you can describe it a bit like a directional traffic light, in the chart, macd crossover happens,the bars go green and the momentum gap appears, quite simply, whilst this happens, only trade long, there is no reason to close whilst green and the gap remains. Alternatively, you could use this to buy the lows and sell the highs throughout the period, its really up to you how you use the indicator.

I have highlighted the entry indicator on the macd (ignore the circle on the standard indicators, couldn't get it off without removing the lower one), and have drawn a line on the price chart to show how, if you choose to ignore the micro fluctuation of the chart, entered a long on the crossover, you have a far greater chance of staying in the trade longer and returning a far higher number of points.

Without stating the obvious, the alternative action happens when prices are heading down.

Have a look and see what you think, I would be interested to hear everyones comments
 

Attachments

  • DOW JONES INDUSTRIAL A.png
    DOW JONES INDUSTRIAL A.png
    12.6 KB · Views: 185
Well, it looked a little too one sided. I was wondering if the Fed were doling out more cheap money, or if the PPT were at work lifting offers. Ian, I was reading the order book.

I was up +22 at one point today, reduced to a mere +8 now after getting wipped on a bad trade and rather frustratingly missing the price 4 times in a row as I tried to cover. Unless there is some extra volatility and a good setup into the close, I'll remain flat for the day.

Nice being flat, no stress :LOL:
 
Tricks,

Shame you were closed out, that entry would have netted you some very handsome points, not one to pry, but perhaps maybe a time to look at your stop loss levels?, are they to close to your entry point. If I'm poking my nose in, tell me to sod off!!!

All the best, speak to you soon
 
How honest is the DAX ?

Dax daily chart looks dreadful yet the dow is only off around 50 from Tues highs...

Is this a leading indicator ? Can it be trusted ?
This disparity is very interesting ..... :LOL: At least imo
 
Dax daily chart looks dreadful yet the dow is only off around 50 from Tues highs...

Is this a leading indicator ? Can it be trusted ?
This disparity is very interesting ..... :LOL: At least imo

I've had sell signals on Dow, S&P, Dax, FTSE, CAC and Ibex this morning, all before 10.00am.... Mmmmm
 
Top