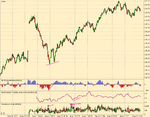
Dow 2007

with everything going on in the markets this week with subprime,credit crunch,central bank bailouts etc.....this seems to have sneaked under the radar,....but could cause just as much market termoil...doesn't rain but pours....:LOL:

China threatens ‘nuclear option’ of dollar sales

http://www.telegraph.co.uk/money/main.jhtml?xml=/money/2007/08/07/bcnchina107a.xml

This is a two edged sword. Economic warfare.

If China calls US bluff everybody loses. By US bluff I mean the US has been asking a lot of the globe. Payback is due. Raise taxes, raise rates or lose the dollar...

I also think it's in China's interest to maintain dollar strength as it probably has most to lose.

Crunch time will be when Iran, Iraq and some other ME oil producing countries including Venezuella starts requesting the Euro as payment.

I think this will rock the UK too as we benefit from reduced cost of oil due our sterling dollar parity which most people over look - at least the public. I never understand why the price at the pump has to rise when the dollar is allways falling againts the pound as it means we get oil cheaper. :rolleyes:

The end may well be nigher than we think? :rolleyes:
 
Right. This belongs in my journal, but 4/5ths of this is Dow related. I made my 5 trades today. 3 premarket, 2 in the cash session. I did the Yen trade I put the order in for at 2am, but I had to manually enter it as I had cancelled the order. Got out at 236.70 for +80. Exit signal was failure to break below the last 5m bar, and gut instinct that a 4 month low had been made and the market had not responded to the price. I got out within 30 tics of the LOD.

Dow - Short 13207 premarket, stopped for BE. Took the entry again, was wrong, out for -22. Took another Short at around 8pm, covered for +4 (this was before it broke 200 up and rallied before the close).

I more short from 13323 in the last few minutes, covered at 13280 (time limit), even though I thought it would break more. +42.

+106 for the day
Trades: 5 (kept my discipline)
Wins: 3
Losses: 2 (including 1 BE, Win> Losses)
Average win: 42
Average loss: 22 (I'm even getting that right.
Net: +106

Have a great weekend all!

Those of you who saw my recent posts regarding discipline and overtrading will be as pleased with my results today as I am. I am going to read some trading books over the weekend, and be positive about my trading today!

nice one lurker, good progress:cheesy:
 
Hi Guys

Any thoughts on taking a flyer on a LONG on the DOW/FTSE/DAX, before markets open.
Papers are talking of a rebound, as the DOW recovered its loss at end of play !!
 
Hi Guys and Gals,

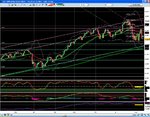
Here's my weekend analysis of the DJ30.

Pluses
continual momentum and volume divergence (yellow markings)
still above uptrend channel
hammer/doji type formation on 10 Aug (thanks to the Fed!)

Minuses
downtrend channel formation
fib 61.8% rejection

My own view is of a test of the upper boundary of the downtrend channel with extreme volatility. If we use the Feb/Mar waterfall as a guide, note the hammer type candle in March07 (blue mark) which led to several up days.

enjoy
 

Attachments

  • DJ30 120807 weekend analysis.JPG
    DJ30 120807 weekend analysis.JPG
    259.3 KB · Views: 130
Last edited:
Hi Guys and Gals,

Here's my weekend analysis of the DJ30.

Pluses
continual momentum and volume divergence (yellow markings)
still above uptrend channel
hammer/doji type formation on 10 Aug (thanks to the Fed!)

Minuses
downtrend channel formation
fib 61.8% rejection

My own view is of a test of the upper boundary of the downtrend channel with extreme volatility. If we use the Feb/Mar waterfall as a guide, note the hammer type candle in March07 (blue mark) which led to several up days.

enjoy

I'm not sure about a break or bounce on the Dow at the moment. I'm looking at 13,350 and 13,100. A break through those levels will probably indicate the next move. Naturally I will also be looking to fade those levels if price and the order book don't confirm a break.

Regarding other markets, I'm thinking of taking another sterling / yen position, this time long on a break of the HOD on Friday (240.53), with an 80 point stop.

fibonelli - are IB really offering a self select ISA? Would this mean you could put futures trades in an ISA and avoid the tax? Surely the Treasury won't be allowing this. You could add £7k a year to your fund, and retain any profits to the ISA tax free...surely they wouldn't allow that? I have a self select share ISA doing nothing right now because of the transaction costs. Imagine trading futures in an ISA.....that would truly take the tax crown away from spreadbetting.
 
not gonna trade the dow next week. Gonna scalp some european markets and coil, and then on a night, sit a watch the order book on the dow to try and get a nack of tape reading. Gonna use pivot points of the pervious trading day high, low and the opening price and see how price and volume reacts. I haven't got a clue what i'm really looking for, but it's something i want to learn.

The way i see it is that all the pros seem to be tape reading, and anyone who's got some serious cash in the market, and has been in the game for a while doesn't seem to be using just charts and indicators as their main tools for trading, which is exactly what i do. Indicators in my opinion can only take you so far, and they obviously all have their individual flaws/problems. I want to try and move away from being so dependable on indicators, because i want to make sure that i'm still here making money in two years time. Steve and a couple of other people have got me interested in reading volume and price because some of the best shots they've called never came up on my radar untill it was too late
 
another reason why i want to learn to tape read.

People say that news that everyone knows is useless. Well... i'm gonna compare my trading with that statement.... Everyman and his dog has got some some MA's and a RSI whacked on a graph of YM. You can go into any book shop and buy a book on technical analysis for a tenner and find a nice trend following system, or better still, just go on the internet and get all the info for free. You can't go into a book shop and really find anything on tape reading, and there is sweet F-A about it on the internet, and hardely anyone except the people who work in the markets know anything about it. So in my eyes, for them reasons alone it's gotta be a long standing winner :D
 
no it's still working and i'm still using it, i'm just trying out new stuff that i've been following for a while. I want to expand my trading skills so i can turn my hand to whatever situation the markets throw at me, because you never know what's just around the corner. I'm not just walking into it blind as a bat like you're making it out. Do you just following my post looking for ways to try and put me down, because that's how it come across to me. It's as if you think i'm just some idiot who has watched wall street too many times, with 200 quid in a SB account trying to scalp his way to a million in a week.

Why do you think i'm sat up on the computer to such stupid times every night? For as long as i care to remember now i've pretty much sat here every night researching, building new systems, back testing, building API's for automated trading. Then i get an e-mail saying that i've got a reply on this forum, only to find some sarcastic or patronising crap from you. Seriously, i ain't arsed if you don't like me, but stop replying with unhelpful crap. I don't particularly like you either, but i don't just post sarcastic and annoying crap post after post in reply to your stuff....

Kev
 
I have deleted my post Kev, I don't want to upset you. However, constructive criticism can benefit an individual.
 
another reason why i want to learn to tape read.

People say that news that everyone knows is useless. Well... i'm gonna compare my trading with that statement.... Everyman and his dog has got some some MA's and a RSI whacked on a graph of YM. You can go into any book shop and buy a book on technical analysis for a tenner and find a nice trend following system, or better still, just go on the internet and get all the info for free. You can't go into a book shop and really find anything on tape reading, and there is sweet F-A about it on the internet, and hardely anyone except the people who work in the markets know anything about it. So in my eyes, for them reasons alone it's gotta be a long standing winner :D

Pretty accurate observation I'd say. The "tape" is where the real business of the markets goes on - not RSI, MAs, Fibs and so on. If Paul Rotter says you've got to understand the order book to be really successful at futures, I'd say that is worth taking note of. The interplay of T&S and the DOM is where supply and demand plays out.

Go for it and ignore all the stuff about how the book is useless because of all the faking and flipping. The latter is just a side show.

Do you know of any good books on the subject? I've decided to buy 1 trading book for each week I am in profit, to augment my weekend studies. I'd be delighted to read something about DOM / T&S / Tape Reading. I was just mentioning the Eurex Flipper to Kev in a related PM actually - great minds!
 
Do you know of any good books on the subject? I've decided to buy 1 trading book for each week I am in profit, to augment my weekend studies. I'd be delighted to read something about DOM / T&S / Tape Reading. I was just mentioning the Eurex Flipper to Kev in a related PM actually - great minds!

Sorry, I don't know of any books. I think it's very much a case of roll your own. I never got anywhere with this stuff until I incorporated it on charts where you can see how things develop over time.

I'm attaching a chart, which is for illustration purposes and not necessarily a prescription for how to lay out a chart for trading purposes.

It is todays K200 with constant volume bars 400 contracts wide.

Second from top plot is a smoothed "market delta" - the difference of traded volume at ask and bid. Notice at the second leg of the double bottom, traders are really starting to hit the ask. Notice also for the duration of the uptrend, volume is predominately at the ask. Notice also the little double top where volume transitions onto the bid.

Third from top is a smoothed "order book delta" the sum of all contracts shown at all levels in the book at ask minus the sum at all levels at bid. This is divided by total book size to normalize. Notice how size remains on the ASK for the duration of the uptrend. It is worth thinking about why this is so.

The bottom plot (which is mislabelled I'll fix the code someday) is the total number of contracts visible in the book. Look at the points where it spikes and look at the "order book delta" at those points and how price changes.

This kind of thing is absolutely typical of stock index futures.
 

Attachments

  • k200_400contracts.png
    k200_400contracts.png
    24.1 KB · Views: 143
Sorry, I don't know of any books. I think it's very much a case of roll your own. I never got anywhere with this stuff until I incorporated it on charts where you can see how things develop over time.

I'm attaching a chart, which is for illustration purposes and not necessarily a prescription for how to lay out a chart for trading purposes.

It is todays K200 with constant volume bars 400 contracts wide.

Second from top plot is a smoothed "market delta" - the difference of traded volume at ask and bid. Notice at the second leg of the double bottom, traders are really starting to hit the ask. Notice also for the duration of the uptrend, volume is predominately at the ask. Notice also the little double top where volume transitions onto the bid.

Third from top is a smoothed "order book delta" the sum of all contracts shown at all levels in the book at ask minus the sum at all levels at bid. This is divided by total book size to normalize. Notice how size remains on the ASK for the duration of the uptrend. It is worth thinking about why this is so.

The bottom plot (which is mislabelled I'll fix the code someday) is the total number of contracts visible in the book. Look at the points where it spikes and look at the "order book delta" at those points and how price changes.

This kind of thing is absolutely typical of stock index futures.

Does "K200" mean 200 ticks per bar? I'm very interested to know how you have put all of this together, and how you use it to scalp the YM. Is this custom software, or just a package I am unfamiliar with. As for the data feed it uses, is it proprietary, or does it work with different feeds? I used to use Opentick with NinjaTrader, and although OT sometimes lags, I'd be interested in a software package which allowed me to use OTfeed for the order book / T&S, and to derive those indicators. Obviously nobody is quite fast enough to assimilate bid/ask ratios for the best ten each side in their head.

I'll get back to you regarding the rest of the post when I understand it. Thanks for sharing!
 
Sorry, the post was a bit brief. K200 is Kospi - Korea stock index futures. It's what I happended to have in front of me at the time. It is my own software with IB feed. Java on Linux. Bar size is 400 contracts - not ticks.

It doesn't really matter if it's K200 or ES or DAX or YM - the principles are more or less the same.

I do also have OpenTick integration but only Level 1 at this time. Doing full OT integration is not a priority for me 'cause I am most interested in asia and europe for time zone reasons.

Thanks for the clarification. That is very impressive - is your source GPL'd, or shared any any other way? (I also use linux, although I don't have IB, and I'd be interested in trying it out)

I'm somewhat concerned about my interest in the order book though. At one point, I was using things like "[NYSE] tick divergence and all that crap"* instead of simply focusing on price and trading what the chart indicated. Perhaps if I go down the road of the order book...

I do feel understanding the book has potential, and I already use it to screen S/R breaks. Perhaps it could be another tool in the box, much like volume, not to be relied on in its own right, but to augment other signals.

* - I can' remember who called it that, but at the time it really was the most suitable way of advising that I was jumping about from system to system without consistency.
 
Top