Dow 2007

Direction

We seem to be getting differing opinions here:-

Atilli & 2468 Steve,looking at a bearish scenario, looking at a triple top!

Catracho Bullish, highlighing the Daily chart looking bullish as per macd and RSI in no mans land.

Hookshot, looking perhaps at breakout.

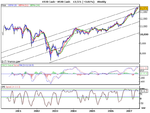
However, the weekly chart, MACD Histogram suggesting change, MACD looking bearish, stochastics 83.6, having crossed target line, but now trending, RSI at 64, not overbought, but fairly high, (mixed messages here then)

Monthly chart, MACD momentum still positive, but stochastics at 95 and at crossover, RSI Overbought at 75,

2-4 hours charts showing conflicting views, stochastic, MACD

15 Min through 1 hour chart looking more bearish

FWIW, imho, be careful about getting carried away adding to positions, I'm not convinced the bear has arrived just yet, this could go either way, a break out would see perhaps head towards the $14, trade carefully, don't overcommit yourself and stick with your trading plan, regular and consistant.
 
Last edited:
possibly a triple top....although going by the Nasdaq Comp and NDX it could be an upside breakout.They've both closed above highs.....TBH though I don't like these short trading weeks.Fake moves all over the show......

cheers

Hi Dinos,
you're supposed to be taking a break....:LOL:

To clarify I'm not in either a bull or bear camp...I'll let the market show me.I was just pointing out that for those that think we may be seeing a triple top to be cautious as both Nas indices had broken topside.How true those breaks are is debatable as there is no volume behind the moves but price held.
For those who believe in Fibs the Nasdaq Comp .382 retacement from it's all time high at 5132 to it's bear market low at 1108 comes in at 2645.....we hit 2644.95 yesterday...of course all the other indices past these retracements a while back so it's only relevent if you adhere to fibs.
One other point .....the NDX .382 retrace comes in at 2331 and if you look at a daily chart going back to Feb 2001 you'll see a big gap between 2355 and 2266 on 15/16 Feb...This has never been filled and falls right in that .382 retrace...we could be heading there ???

Enjoy your break m8....

Steve
 
Hi Steve,

I am, just popped in as I visited my broker and re-adjusted my stoplosses and set limit orders on my trades from yesterday.

All done now

Good luck and happy trading
 
Fake moves.

I think steve is referring to the markets action on lighter volume with the shorter trading day before the US holiday.
 
I think steve is referring to the markets action on lighter volume with the shorter trading day before the US holiday.

exactly Ian....I like to see swing points,highs/lows, approached and/or taken out on at least similar volume,preferably more...this to me is a real move....volume this week has been predictably low so it allows the major players to push things around to wherever they want....ultimately price dictates and both Nas indices closing at highs is still significant,but the volume cautions me to the reality of these moves....how sustainable are higher prices if less people want that indice at those prices......

for a confirmation of a false move we now need to see on the weekly chart a close beneath 2634 on Nas and 1948 on NDX by Friday as this would then show a rejection of the highs on what will be inevitably lighter volume.....

cheers
 
I stopped trading this due to fake outs. No trades today or tomorrow, or indeed until volume picks up and there is a new high / low made. (we need some idea of the bearish and bullish consensus).

Good trading all.
 
I stopped trading this due to fake outs. No trades today or tomorrow, or indeed until volume picks up and there is a new high / low made. (we need some idea of the bearish and bullish consensus).

Good trading all.

Hi chaps,

Excellent points of view. Ultimately as Dinos says we need to stick to our trusted systems which we are comfortable with.

Increasingly I really have grown to Standard Error Channels. As in my graph this is way at the top on the weekly charts. 4 Hour charts also a sell. Also from last nights study I can clearly see lower highs and a turn down now would be very bearish for the Dow imo.

The dailies charts do look a little bullish, but as has been suggested I think this is to do with the holiday period and light volumes. The indicators I don't trust as much as the long term view.

I also feel on balance FA and TA news consistent with each other. Hence, I would say I'm with the bears. Cubs and not grisslies but never the less with the teddies. :D

As I am at work all day long I don't check the charts or make any trades. So I've started to take a long term view on the charts. So far so good.

Sub-prime lending still a big concern. Even the UK started looking into it now and the market here is only 5% of total mortgage borrowing compared to 30% in the US.

So all put together I'm still short on the DOW and Cable at the mo.

Good trading everyone.
 

Attachments

  • US30 Cash070704.png
    US30 Cash070704.png
    19.8 KB · Views: 122
interesting observations from John Murphy:

NYSE COMPOSITE MOVES BACK ABOVE 10000... The NYSE Composite edged higher on Tuesday and this was enough to recapture the 10000 level. A nice round level like this would normally be seen as “psychologically” important, especially for the Dow. However, the NYSE Composite is a little more obscure and the 10000 level does not carry as much “psychological” importance. However, technically, there is some important resistance just above 10000. The index first moved above 10000 in early June and failed to hold above. There was another attempt to cross 10000 in mid June and the index again failed to hold this level. Tuesday’s move above 10000 marks the third attempt in five weeks and there is considerable resistance just above 10000. A consolidation has formed the last six weeks and a break above the June highs is needed to reassert the uptrend. Unlike its tech cousin, the NYSE Composite broke to new highs at the end of 2004 (new all time highs). The index continued higher and is on the verge of yet another new all time high in July.
 
You know why he says that ?

It can statistically be shown that the day after a holiday in the US market is a down day, much more often than an up day.
Tomorrow is the 4th July, US Holiday.

If I'd flipped a coin every 5th July for last ten years and it had come up heads for 8 of those years,statistically would this 5th July be heads because it has been for last 8/10 years,or tails because it has to be tails eventually........regardless of statistics,trends,hocus pocus,full moons etc it will always be 50/50 chance of either heads/tails......
"There are three types of lies - lies, damn lies, and statistics." - Variously attributed to Benjamin Disraeli, Alfred Marshall, Mark Twain and many other dead people......

cheers
 
"There are three types of lies - lies, damn lies, and statistics." - Variously attributed to Benjamin Disraeli, Alfred Marshall, Mark Twain and many other dead people......

cheers

it was actually me that invented this saying. And i'm usually right 98% of the time.

:D
 
anyone watching Dax.....just tumbled 60 pts in 15 mins..........what was that all about.....:rolleyes:
 
Top